Detect false sharing with Data Address Profiling.
17 Dec 2019
Contents:
Subscribe to my newsletter, support me on Patreon or by PayPal donation.
This article is a continuation of my series of posts about performance analysis of multithreaded (MT) applications. Other parts of the series can be found here:
- Performance analysis of multithreaded applications.
- How to find expensive locks in multithreaded application.
- Detecting false sharing with Data Address Profiling (this article).
Today we will touch on false sharing a bit and how to detect it, but mostly this article will be dedicated to one interesting performance monitoring feature which is called Data Address Profiling (DLA). If you visit this blog post and want to know how to find out if you have false sharing in your application but don’t care about the underlying mechanism of “how”, you probably want to jump into this blog post. If you are interested in the DLA feature and want to know how else it can be useful, keep on reading this article.
What is Data Address Profiling and how it works?
DLA feature is covered in the Intel® 64 and IA-32 Architectures Developer’s Manual: Vol. 3B. In particular, find the chapter with the name “PEBS Data Address Profiling”. You may also encounter that it is referred to as Data Linear Address (DataLA) and sometimes PSDLA.
DLA feature provides means to profile load and store memory references in the system. It leverages the PEBS facility to provide additional information about sampled loads and stores. Particularly, memory addresses and latency of the sampled memory access.
If told so, CPU keeps additional information about the memory access inside the PEBS record which looks like this (image is taken from Intel manual):
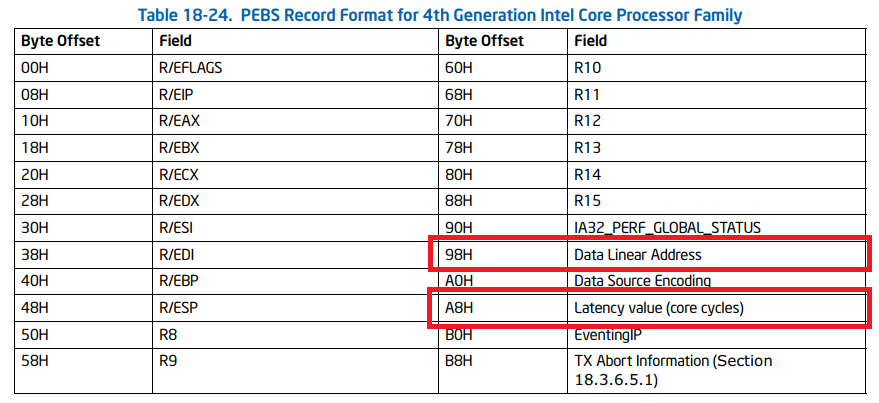
If it doesn’t make sense to you, I greatly encourage you to read one of my previous articles about profiling basics. Briefly, profiling tool catches performance monitoring interrupts. Inside interrupt service routine the tool grabs the PEBS buffer and extracts needed information from it. This is how we can get this information out.
Keep in mind, this feature does not trace all the stores and loads. Otherwise, the overhead would be quite big. Instead, it takes only one sample each 1000 loads, or so. It is customizable how much samples per second you want. The higher the rate, the better accuracy you have, but the overhead will also be higher.
Example of usage
The first enabling of DLA feature in Linux perf was implemented in perf mem tool (man page). Here is how one can use it:
$ perf mem record -- ./a.out
Let me first show you the guts. Remember, perf mem record samples on memory accesses (loads and stores). For each recorded sample perf mem record additionally saves memory address and how long the access took:
$ perf report -D
...
0x2eb0 [0x40]: event: 9
.
. ... raw event: size 64 bytes
.  0000:  09 00 00 00 01 40 40 00 07 3f 62 ab ff ff ff ff  .....@@..?b.....
.  0010:  70 0a 00 00 70 0a 00 00 6b 9a d5 91 e0 02 00 00  p...p...k.......
.  0020:  00 51 2a d4 4c 91 ff ff c6 00 00 00 00 00 00 00  .Q*.L...........
.  0030:  ad 00 00 00 00 00 00 00 42 10 20 68 1a 00 00 00  ........B. h....

3163542624875 0x2eb0 [0x40]: PERF_RECORD_SAMPLE(IP, 0x4001):
2672/2672: 0xffffffffab623f07 period: 198 addr: 0xffff914cd42a5100
... weight: 173
 . data_src: 0x1a68201042
 ... thread: a.out:2672
This is the dump of one of the samples and it shows its raw bytes. For curiosity, you can compare it with a sample without memory address and access latency. You can find the example of such a sample obtained from simple perf record in one of my earlier articles. You can find the encoding for weight which is 0xad and memory address inside it.
Keep in mind, this raw sample does not replicate the PEBS record. It is internal format which is used by Linux perf. The tool parses PEBS record and encodes only interesting information into the sample.
One note on the memory latency (displayed as weight) taken from here:
On Intel processors with PEBS Load Latency, as described in the SDM, the cost encompasses the number of cycles from dispatch to Globally Observable (GO) state. That means, that it includes OOO execution. It is not usual to see L1D Hits with a cost of > 100 cycles. Always look at the memory level for an approximation of the access penalty, then interpret the cost value accordingly.
Now, I don’t think perf mem report provides very much value by itself, but let’s take a look at it:
$ perf mem report --stdio
# Samples: 36K of event 'cpu/mem-loads,ldlat=30/P'
# Total weight : 2171308
# Sort order   : local_weight,mem,sym,dso,symbol_daddr,dso_daddr,snoop,tlb,locked
#
# Overhead  Samples   Weight  Memory access    Symbol      Object     Data Symbol             Data Object  TLB access
# ........  .......   ......  .............    ......      ......     .................       ...........  ...........
#
   0.01%      2        113     LFB or LFB hit  [.] main    a.out      [.] 0x00007ffff274b000  [stack]      L1 or L2 hit
   0.01%      2        113     LFB or LFB hit  [.] main    a.out      [.] 0x00007ffff274d018  [stack]      L1 or L2 hit
   0.01%      1        225     L1 or L1 hit    [.] main    a.out      [.] 0x00007fe3c954fa48  anon         L2 miss
   0.01%      1        225     L1 or L1 hit    [.] main    a.out      [.] 0x00007fe3c9a1d2a0  anon         L2 miss
   0.01%      1        224     L1 or L1 hit    [.] main    a.out      [.] 0x00007fe3c97600d8  anon         L2 miss
   0.01%      1        224     L1 or L1 hit    [k] <addr>  [unknown]  [k] 0xffff9e9f03257b68  [unknown]    L1 or L2 hit
...
This is a pretty long list, because in my test application I have a large array and I access random locations inside it. Rarely we have samples for the same load/store, that’s why the overhead for individual locations is that small. Think about this report as: which memory location is the most expensive to access?
Again, you probably should not rely too much on the latencies(weights) displayed above. Obviously, load that hits in L1 should not take 100 cycles, that is nuts. But if we count the whole time it takes until the load takes effect, that is certainly possible. Consider a situation when the load is scheduled by the OOO engine early. It needs to be retired only after all the instructions in the program order have already retired. And it can be a very long window. This is why we can see 100s of cycles for the load to complete. I haven’t yet developed my intuition about how to interpret latencies (weights) of memory accesses. My best advice for now will be to look for anomalies. Note that perf mem record by default records only loads with a latency of 30 cycles or more.
Also, I think it makes sense to analyze 2 columns together: “TLB access” and “Memory access”. I.e., notice in the first two rows we have hits in LFB (Line Fill Buffer) AND hits in TLB L1/L2. This is pretty fast scenario. In the next column we have TLB L2 miss which triggers a page walk. This is why we see two times slower access time.
Unfortunately, you don’t get nice information about to which variable/data structure the load/store is going to. All you get is just the raw address. Usually you need to track this information by your own to map back the raw addresses into some meaningful objects. This might get especially tricky for variables allocated on the stack, since the same address on the stack can be assigned to a different program objects in a different moment of the program execution.
Take a look at another good example by Travis Downs on stackoverflow.
Where it can be useful?
1. Detect false sharing.
I think for the major part of software developers this will be the most interesting one. For recap on false sharing you might want to visit wikipedia page.
There is a great tool for detecting cache contention such as false/true sharing: perf c2c. In a few words, it tries to match up store/load addresses for different threads and see if the hit in a modified cacheline occurred. There is a pretty good explanation of the process written in this blog post. Like usual, you first collect data with perf c2c record then generate a report output with perf c2c report.
If you have access to Intel Vtune you might want to check this and this. You can run “General Exploration” analysis to identify that the bottleneck is because of false sharing and then run “Memory Access” analysis to find a contended data structure.
2. Tune the code for better utilization of cache hierarchy.
Let’s say you have a memory bound loop and you want to tune it for cache blocking. The addresses sampled for the loop tell you roughly what ranges of memory your loop accessed. The latencies tell you how long it took to access memory. Those two things can guide you in optimizing the access patterns to be as cache hierarchy friendly as possible.
3. Tune memory allocation.
Sometimes you can spot interesting things by mapping raw addresses to the NUMA nodes and address spaces. For example, you may find that some threads access memory allocated on a remote NUMA nodes and accesses to such memory can be expensive. This is only possible if you track enough information in the application. This might help you in tuning memory allocation if the application is running on multiple sockets.
4. Get overall statistic
For instance, here is how you can get overall information about the loads: how much % of the loads hit L1?
$ perf mem -t load report --sort=mem --stdio
# Samples: 656  of event 'cpu/mem-loads,ldlat=30/P'
# Total weight : 136578
# Overhead       Samples  Memory access
# ........  ............  ........................
#
    44.23%           267  LFB or LFB hit
    18.87%           111  L3 or L3 hit
    15.19%            78  Local RAM or RAM hit
    13.38%            77  L2 or L2 hit
     8.34%           123  L1 or L1 hit
All content on Easyperf blog is licensed under a Creative Commons Attribution 4.0 International License