Four Cornerstones of CPU Performance.
17 Oct 2022
Contents:
- Predictability of Code
- Execution Throughput
- Predictability of Data
- Data Dependency Chains
- Closing thoughts:
Subscribe to my newsletter, support me on Patreon or by PayPal donation.
There are many ways to analyze performance of an application running on a modern CPU, in this post I offer you one more way to look at it. The concept I write about here is important to understand and to have a high-level understanding of the limitations that the current CPU computing industry is facing. Also, the mental model I present will help you to better understand performance of your code. In the second part of the article, I expand on each of the 4 categories, discuss SW and HW solutions, provide links to the latest research, and say a few words about future directions.
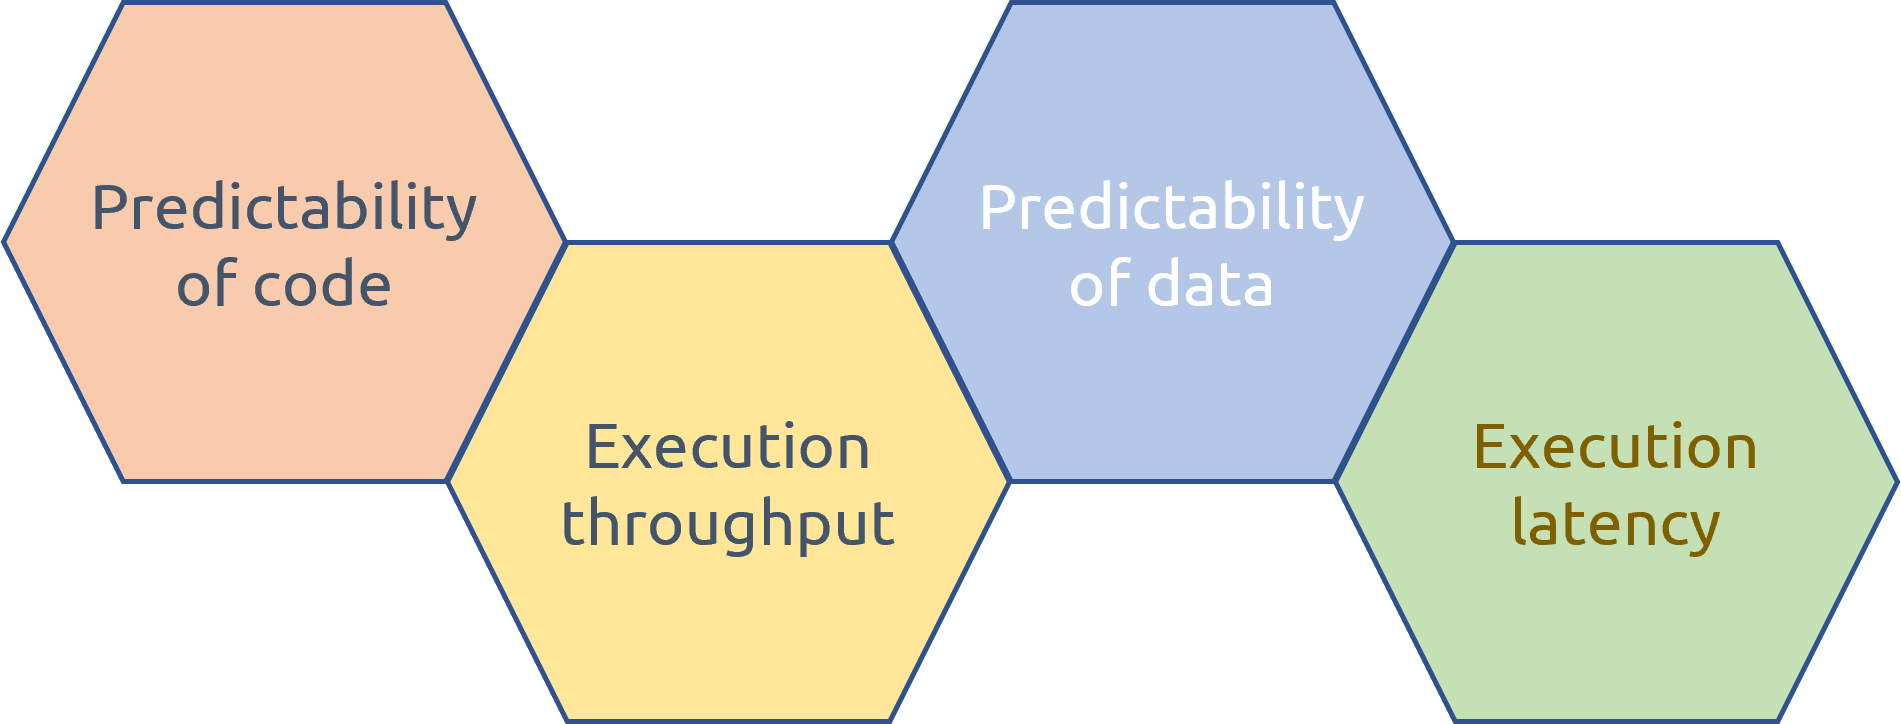
Let’s jump straight into it. At the CPU level, performance of any application is limited by 4 categories:
- Predictability of Code
- Predictability of Data
- Execution Throughput
- Execution Latency
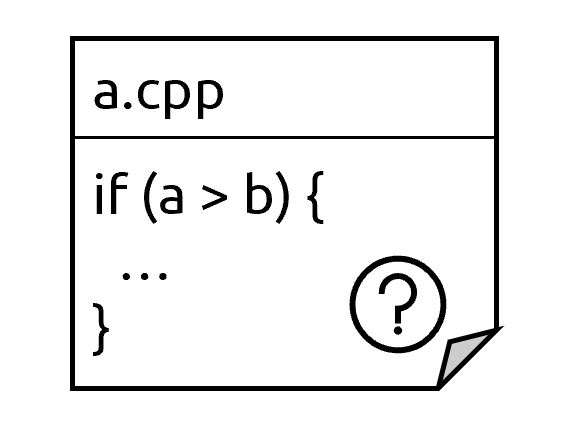
Think about it like this. First, modern CPUs always try to predict what code will be executed next (“predictability of code”). In that sense, a CPU core always looks ahead of execution, into the future. Correct predictions greatly improve execution as it allows a CPU to make forward progress without having results of previous instructions available. However, bad speculation often incurs costly performance penalties.
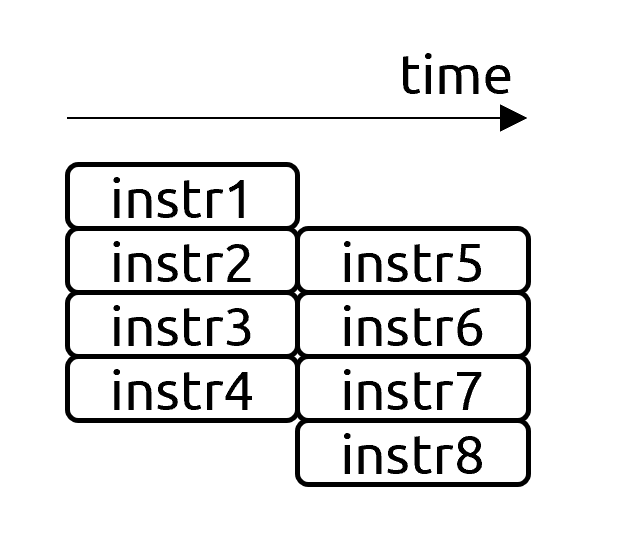
Second, a processor fetches instructions from memory and moves them through a very sophisticated execution pipeline (“execution throughput”). How many independent instructions a CPU can execute simultaneously determines the execution throughput of a machine. In this category, I include all the stalls that occur as a result of a lack of execution resources, for example, saturated instruction queues, lack of free entries in the reservation station, not enough multiplication or divider units, etc.
Third (“predictability of data”), some instructions access memory, which is one of the biggest bottlenecks nowadays as the gap in performance between CPU and memory continues to grow. Hopefully, everyone by now knows that accessing data in the cache is fast while accessing DRAM could be 100 times slower. That’s the motivation for the existence of HW prefetchers, which try to predict what data a program will access in the nearest future and pull that data ahead of time so that by the time a program demands it to make forward progress, the values are already in caches. This category includes issues with having good spatial and temporal locality, as caches try to address both. Also, I include all the TLB-related issues under this category.
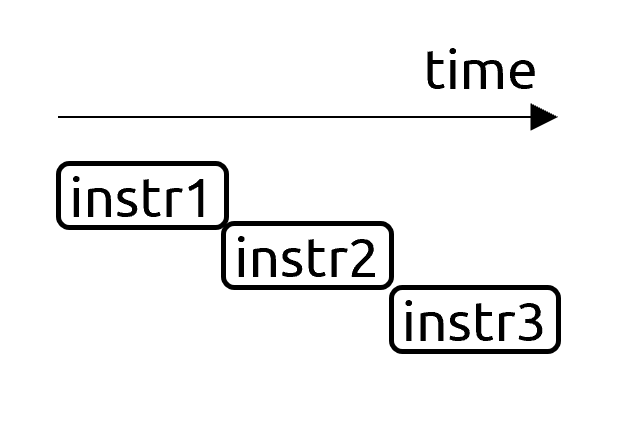
Fourth (“execution latency”), the vast majority of applications have many dependency chains when you first need to perform action A before you can start to execute action B. So, this last category represents how well a CPU can execute a sequence of dependent instructions. Just for the record, some applications are massively parallel, which have small sequential portions followed by large parallel ones – such tasks are limited by execution throughput, not latency.
A careful reader can draw parallels with a Top-Down performance analysis methodology, which is true. Below I provide a corresponding TMA metric for each of our 4 categories.
- Predictability of Code (Bad Speculation)
- Execution Throughput (FE Bound, BE bound, Retiring)
- Predictability of Data (Memory Bound)
- Execution Latency (BE bound)
Let’s expand on each of those categories.
Predictability of Code
- Definition: How well a CPU can predict the control flow of a program (Branch prediction).
- Ideal: Every branch outcome is predicted correctly in 100% of the cases, for example when a branch is always taken.
- Worst: algorithms with high entropy, with no clear control flow pattern, e.g. random numbers.
- Current: Today, state of the art prediction is dominated by TAGE-like [Seznec] or perceptron-based [Jimenez] predictors. Championship branch predictors make less than 3 mispredictions per 1000 instructions. Modern CPUs routinely reach >95% prediction rate on most workloads.
- SW mitigations: Use branchless algorithms (lookup tables, predication, etc) to replace frequently mispredicted branches. Reduce the total number of branches.
- Future: Improving prediction will unlikely move the needle for most programs, as it is already quite good. For programs that have hard-to-predict branches, there are some potential solutions. First, SW-aided prediction, for example [Whisper], which moves prediction for some branches from HW to SW. Second, a hybrid approach, where the standard predictor is accompanied by a separate engine (trained offline), which only handles hard-to-predict branches [BranchNet].
Execution Throughput
- Definition: How well instructions progress through the CPU pipeline. This includes fetching, discovering independent instructions (aka “extracting parallelism”), and issuing and executing instructions in parallel. The width of a CPU pipeline characterizes how many independent instructions it can execute per cycle.
- Ideal: From the HW side, the ideal is to have an infinite-wide microarchitecture with unlimited OOO capacity and an infinite number of execution units. (Impossible to reach in practice). From the SW side, the ideal is when an application reaches the maximum theoretical throughput of a machine (aka roofline).
- Worst: Algorithms with a very low Instruction Level Parallelism (ILP), that underutilize the computing capabilities of a machine.
-
Current: Stalls frequently occur as a lack of some execution resources. It is very hard to predict which resource in a CPU pipeline will be a bottleneck for a certain application. Collecting CPU counters will give you some insight, but a more general recommendation would be to use Top-Down Analysis. OOO machines are very good at extracting parallelism, although there are blind spots. They can easily catch “local” parallelism within a mid-size loop or function, but can’t find global parallelism, for example:
foo(); // large non-inlined function
bar(); // bar does not depend on foo
If a processor would overlap the execution of
fooandbar, that would significantly speed up the program, but currently, CPUs execute such code sequentially1.Modern architectures range from 4-wide to 8-wide. Increasing the width of a machine is very costly as you need to simultaneously widen all the elements of the CPU pipeline to keep the machine balanced. The complexity of making wider designs grows rapidly, which makes it impossible to build such a system in practice.
- SW mitigations: To reach the roofline performance of a machine, one needs to make sure that the parallelism in a program is easily discovered by a CPU. Compilers nowadays handle most of the simple cases themselves, so you don’t usually need to swap lines of code to achieve better instruction scheduling. Other cases are harder to solve. For example, in the example above, to overlap execution of
forandbar, one would need to manually unroll and interleave both functions, but then you could run out of available registers, which will generate memory spills and refills (hurts performance but could be still worthwhile). - Future: The width of modern CPUs will become wider for a couple of years but may eventually hit the limit. There are three primary reasons for that. First, a very small portion of SW is massively parallel, so making a super wide pipeline doesn’t make sense. A rule of thumb is that an average ILP in the general-purpose code is 2, meaning that you can execute 2 instructions simultaneously at any given moment. The second reason is managing complexity and keeping the machine in balance as we discussed above. And third, we already have a good solution for massively parallel software: GPUs and other accelerators.
Predictability of Data
- Definition: How well a CPU can hide the latency of memory accesses by prefetching the data ahead of time.
- Ideal: sequential memory accesses.
- Worst: random memory accesses (e.g. accessing hash maps, histograms), evicting the data that will be reused later (e.g. reiterating over a large data set), CPU cores compete for a space in L2/L3 while trashing each other’s data.
- Current: L1, L2, and L3 cache access latency is not decreasing, but their sizes are growing. As of 2022, typical laptops can have L3 cache anywhere from 10-50 MB, and some high-end gaming laptops may even have ~100 MB of LLC. Having a large cache is not a silver bullet though. Yes, it helps with avoiding eviction of data that will be reused later, but it’s helpless with random memory accesses.
- SW mitigations: Data layout transformations, loop transformations (blocking, interchange, etc.), data packing, avoiding cache trashing, cache warming, etc.
-
Future: Cache sizes will likely continue to grow, although writing SW cache-friendly algorithms usually makes much more impact.
There is a revolutionary idea called PIM (Processing-In-Memory), which moves some computations (for example, memset, memcpy) closer to where the data is stored. Ideas range from specialized accelerators to direct in-DRAM computing. The main roadblock here is that it requires a new programming model for such devices thus rewriting the application’s code. [PIM]
Also, there are a few ideas for more intelligent HW prefetching. For example: [Pythia] uses reinforcement learning to find patterns in past memory request addresses to generate prefetch requests, [Hermes] tries to predict which memory accesses will miss in caches and initiates DRAM access early.
Data Dependency Chains
- Definition: How well a CPU can process a long sequence of instructions, where each of them depends on a previous one.
- Ideal: There is no ideal case as it is impossible to speed up true data dependency in the general case. From the SW point of view, massively parallel applications with few/short dependencies are ideal scenarios.
- Worst: a long chain of dependent instructions with no other useful work to hide the latency of such a chain.
- Current: It is becoming the dominant reason for performance issues in a general-purpose application. CPU vendors try to tackle it by 1) decreasing the latency of individual instructions, and 2) increasing CPU frequency. Some machine instructions are heavier than others, and often you can implement them in different ways, so it becomes a tradeoff what latency you want to have for the available transistor budget (and corresponding die area) you’re willing to spend. This tradeoff is especially pronounced for vector instructions, multiplications, and divisions. Another way how architects speed up individual instructions is by recognizing idioms and resolve them without consuming execution resources, for example, zero and move elimination, immediate folding, etc.
- SW mitigations: Sometimes it is possible to break unnecessary data dependency chains or overlap their execution. Otherwise, your best bet is to remove any computations that could become an obstacle for a CPU while it executes a long dependency chain.
- Future: It’s hard to say whether we will see future uplifts in CPU clock frequency, despite the end of Dennard scaling. It is a topic of heated discussions and I’m not an electrical engineer to give my educated guess. There is one interesting idea to speed up data dependency chains, which is called “Value Prediction”. It tries to predict the result of certain instructions in a similar way we predict branch outcomes. If the same value is returned from an instruction many times in a row, there is a high probability we could guess it next time. This speculation will allow us to break a dependency chain and start executing from the middle of it. We cannot speculate what would be the result of every instruction, so we need to be very selective, still, the idea requires significant changes to an OOO engine, which makes HW architects reluctant to implement it in the real HW. [Perais] [Seznec]
Closing thoughts:
Every now and then HW architects have an increase in the number of transistors they can use in the chip design. These new transistors can be used to increase the size of caches, improve branch prediction accuracy or make the CPU pipeline wider by proportionally enlargening all the internal data structures and buffers, adding more execution units, etc.
Data dependency chains are the hardest bottleneck to overcome. From an architectural standpoint, there is not much modern CPUs can do about it. Out-of-Order engines, which are employed by the majority of modern processors, are useless in the presence of a long dependency chain, for example traversing a linked list aka pointer chasing. While you can do something to influence other categories (improve branch prediction, more intelligent HW prefetchers, make your pipeline wider), so far modern architectures don’t have a good response to handling Read-After-Write (aka “true”) data dependencies.
I hope that this post gave you a useful mental model, which will help you better understand performance of modern CPU cores. To fine-tune performance of an application means that you tailor the code to the HW, that runs that code. So, it’s not only useful to know the limitations of HW, but it is also critical to understand to which category your application belongs. Such data will help you focus on the performance problem that really matters.
Top-Down microarchitecture analysis and Roofline performance analysis should usually be a good way to start. Most of the time you’ll see a mix of problems, so you have to analyze hotspots case by case. Figuring out predictability of code or data is relatively easy (you check Top-Down metrics) while distinguishing if your code is limited by throughput or latency is not. I will try to cover it in my future posts.
I expect that this post could spawn a lot of comments from people pointing out my mistakes and inaccuracies. Also, let me know if I missed any important ideas and papers, I would be happy to add them to the article.
-
There could be some execution overlap when
fooends andbarstarts. To be fair, it is possible to parallelize the execution offooandbarif, say, we spawn a new thread forbar. ↩
All content on Easyperf blog is licensed under a Creative Commons Attribution 4.0 International License