Top-Down performance analysis methodology.
09 Feb 2019
Contents:
Subscribe to my newsletter, support me on Patreon or by PayPal donation.
This post aims to help people that want to better understand performance bottlenecks in their application. There are many existing methodolgies to do performance anlysis, but not so many of them are robust and formal. When I was just starting with performance work I usually just profiled the app and tried to grasp through the hotspots of the benchmark hoping to find something there. This often lead to random experiments with unrolling, vectorization, inlining, you name it. I’m not saying it’s always a loosing strategy. Sometimes you can be lucky to get big performance boost from random experiments. But usually you need to have very good intuition and luck :).
In this post I show more formal way to do performance analysis. It’s called Top-down Microarchitecture Analysis Method (TMAM) (Intel® 64 and IA-32 Architectures Optimization Reference Manual, Appendix B.1). In this metodology we try to detect what was stalling our execution starting from the high-level components (like Front End, Back End, Retiring, Branch predictor) and narrowing down the source of performance inefficiencies.
It’s an iterative process with 2 steps:
- Identify the type of the performance problem.
- Locate the exact place in the code using PEBS (precise event).
After fixing performance issue you repeat the process again.
If it doesn’t make sense to you yet, don’t worry, it’ll become clear with the example.
TMAM concept
TMAM conceptually works in a “black box” manner, with assumption that we don’t know nothing about the benchmark. Let’s imagine we have the binary (a.out) and it runs for 8.5 sec:
$ time -p ./a.out
real 8.53
TMAM methodology is implemented in toplev tool that is a part of pmu-tools written by Andi Kleen.
Step 1
This is the two most important pictures for TMAM (taken from Intel manual, see link above). First is the breakdown of metric levels in TMAM and second shows reasoning for a single uop:
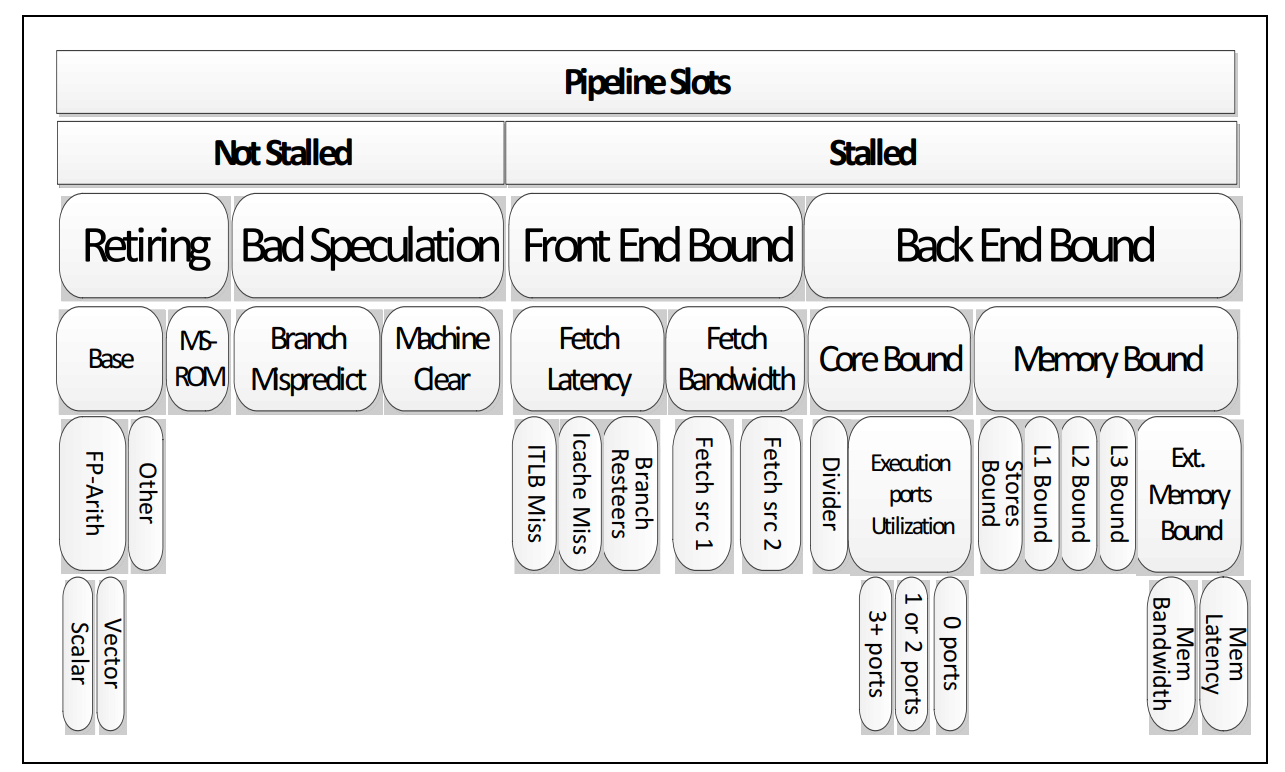
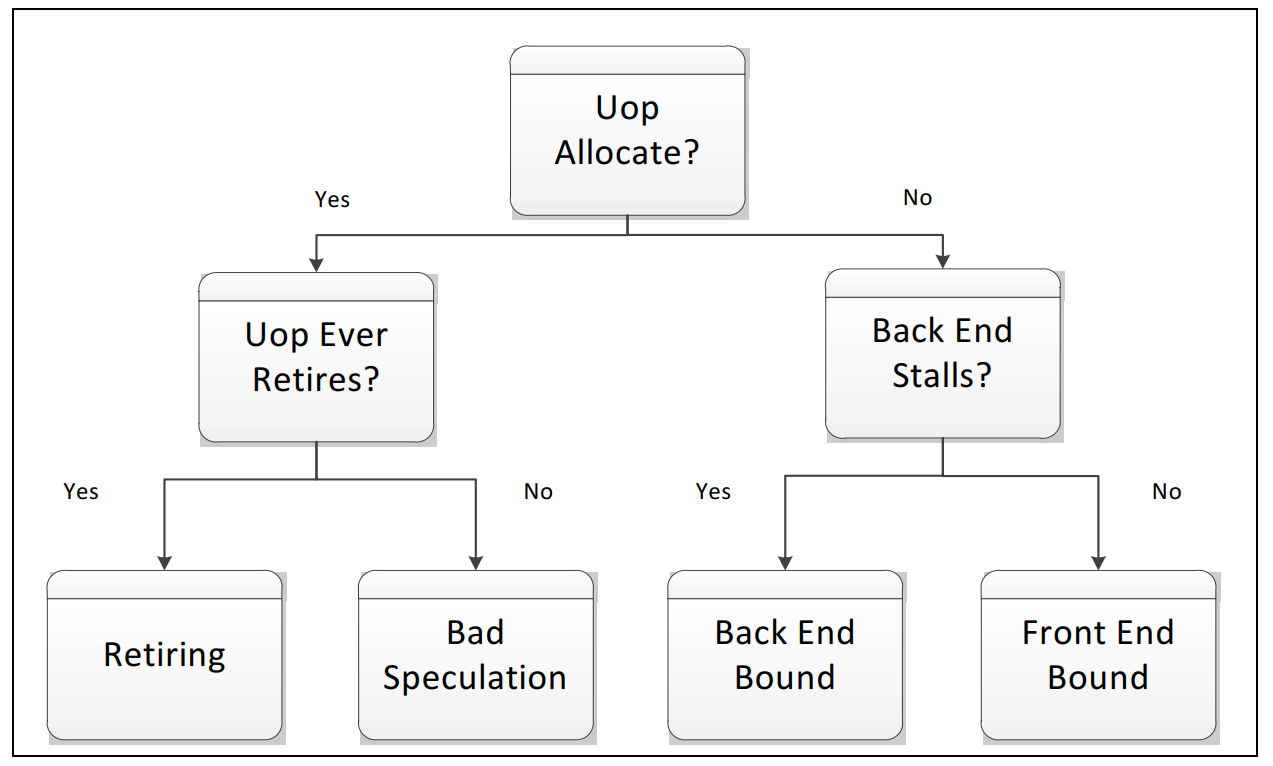
We will run our app and collect specific metrics that will help us to characterize our application. We will try to detect in which category our application will fall to.
Let’s run it, collecting level-1 metrics on our binary:
$ ~/pmu-tools/toplev.py --core S0-C0 -l1 -v --no-desc taskset -c 0 ./a.out
...
S0-C0    FE             Frontend_Bound:          13.81 +-     0.00 % Slots below
S0-C0    BAD            Bad_Speculation:          0.22 +-     0.00 % Slots below
S0-C0    BE             Backend_Bound:           53.43 +-     0.00 % Slots       <==
S0-C0    RET            Retiring:                32.53 +-     0.00 % Slots below
S0-C0-T0                MUX:                    100.00 +-     0.00 %
S0-C0-T1                MUX:                    100.00 +-     0.00 %
All right, now we know that we are bounded by backend. Let’s drill one level down:
$ ~/pmu-tools/toplev.py --core S0-C0 -l2 -v --no-desc taskset -c 0 ./a.out
...
S0-C0    FE             Frontend_Bound:                             13.92 +-     0.00 % Slots below
S0-C0    BAD            Bad_Speculation:                             0.23 +-     0.00 % Slots below
S0-C0    BE             Backend_Bound:                              53.39 +-     0.00 % Slots
S0-C0    RET            Retiring:                                   32.49 +-     0.00 % Slots
S0-C0    FE             Frontend_Bound.Frontend_Latency:            12.11 +-     0.00 % Slots below
S0-C0    FE             Frontend_Bound.Frontend_Bandwidth:           1.84 +-     0.00 % Slots below
S0-C0    BAD            Bad_Speculation.Branch_Mispredicts:          0.22 +-     0.00 % Slots below
S0-C0    BAD            Bad_Speculation.Machine_Clears:              0.01 +-     0.00 % Slots below
S0-C0    BE/Mem         Backend_Bound.Memory_Bound:                 44.59 +-     0.00 % Slots       <==
S0-C0    BE/Core        Backend_Bound.Core_Bound:                    8.80 +-     0.00 % Slots below
S0-C0    RET            Retiring.Base:                              24.83 +-     0.00 % Slots below
S0-C0    RET            Retiring.Microcode_Sequencer:                7.65 +-     0.00 % Slots
Okay, we see that we are actually bounded by memory. Almost half of the execution time CPU was stalled waiting for memory requests to arrive. Let’s try one level deeper:
$ ~/pmu-tools/toplev.py --core S0-C0 -l3 -v --no-desc taskset -c 0 ./a.out
...
S0-C0    FE             Frontend_Bound:                                 13.91 +-     0.00 % Slots below
S0-C0    BAD            Bad_Speculation:                                 0.24 +-     0.00 % Slots below
S0-C0    BE             Backend_Bound:                                  53.36 +-     0.00 % Slots
S0-C0    RET            Retiring:                                       32.41 +-     0.00 % Slots
S0-C0    FE             Frontend_Bound.Frontend_Latency:                12.10 +-     0.00 % Slots below
S0-C0    FE             Frontend_Bound.Frontend_Bandwidth:               1.85 +-     0.00 % Slots below
S0-C0    BAD            Bad_Speculation.Branch_Mispredicts:              0.23 +-     0.00 % Slots below
S0-C0    BAD            Bad_Speculation.Machine_Clears:                  0.01 +-     0.00 % Slots below
S0-C0    BE/Mem         Backend_Bound.Memory_Bound:                     44.58 +-     0.00 % Slots
S0-C0    BE/Core        Backend_Bound.Core_Bound:                        8.78 +-     0.00 % Slots below
S0-C0    RET            Retiring.Base:                                  24.77 +-     0.00 % Slots below
S0-C0    RET            Retiring.Microcode_Sequencer:                    7.63 +-     0.00 % Slots
S0-C0    FE             Frontend_Bound.Frontend_Bandwidth.MITE:          7.33 +-     0.00 % CoreClocks below
S0-C0    FE             Frontend_Bound.Frontend_Bandwidth.DSB:           2.19 +-     0.00 % CoreClocks below
S0-C0    FE             Frontend_Bound.Frontend_Bandwidth.LSD:           0.00 +-     0.00 % CoreClocks below
S0-C0-T0 FE             Frontend_Bound.Frontend_Latency.ICache_Misses:            0.05 +-     0.00 % Clocks below
S0-C0-T0 FE             Frontend_Bound.Frontend_Latency.ITLB_Misses:              0.00 +-     0.00 % Clocks below
S0-C0-T0 FE             Frontend_Bound.Frontend_Latency.Branch_Resteers:          0.10 +-     0.00 % Clocks_Estimated below
S0-C0-T0 FE             Frontend_Bound.Frontend_Latency.DSB_Switches:             0.00 +-     0.00 % Clocks below
S0-C0-T0 FE             Frontend_Bound.Frontend_Latency.LCP:                      0.00 +-     0.00 % Clocks below
S0-C0-T0 FE             Frontend_Bound.Frontend_Latency.MS_Switches:              3.86 +-     0.00 % Clocks
S0-C0-T0 BE/Mem         Backend_Bound.Memory_Bound.L1_Bound:                      4.39 +-     0.00 % Stalls below
S0-C0-T0 BE/Mem         Backend_Bound.Memory_Bound.L2_Bound:                      2.42 +-     0.00 % Stalls below
S0-C0-T0 BE/Mem         Backend_Bound.Memory_Bound.L3_Bound:                      5.75 +-     0.00 % Stalls
S0-C0-T0 BE/Mem         Backend_Bound.Memory_Bound.DRAM_Bound:                   47.11 +-     0.00 % Stalls                 <==
S0-C0-T0 BE/Mem         Backend_Bound.Memory_Bound.Store_Bound:                   0.69 +-     0.00 % Stalls below
S0-C0-T0 BE/Core        Backend_Bound.Core_Bound.Divider:                         8.56 +-     0.00 % Clocks below
S0-C0-T0 BE/Core        Backend_Bound.Core_Bound.Ports_Utilization:              11.31 +-     0.00 % Clocks below
S0-C0-T0 RET            Retiring.Base.FP_Arith:                                   1.45 +-     0.00 % Uops below
S0-C0-T0 RET            Retiring.Base.Other:                                     98.55 +-     0.00 % Uops below
S0-C0-T0 RET            Retiring.Microcode_Sequencer.Assists:                     0.00 +-     0.00 % Slots_Estimated below
S0-C0-T0                MUX:                                                      3.45 +-     0.00 %
Cool! We found the bottleneck. Step #1 is completed. Let’s now go to the step #2.
Step 2
To locate the place in the code where this is happening, we need to refer to the TMA metrics table. I know, I know, it looks scary and big. Don’t worry. It’s complex only when you see it the first time.
For Skylake architecture DRAM_Bound metric is calculated using CYCLE_ACTIVITY.STALLS_L3_MISS performance event. Let’s collect it:
$ perf stat -e cycles,cpu/event=0xa3,umask=0x6,cmask=0x6,name=CYCLE_ACTIVITY.STALLS_L3_MISS/ ./a.out
       32226253316      cycles
       19764641315      CYCLE_ACTIVITY.STALLS_L3_MISS
According to the definition of CYCLE_ACTIVITY.STALLS_L3_MISS it counts cycles when execution stalls while L3 cache miss demand load is outstanding. We can see that there are ~60% of such cycles which is pretty bad.
In the Locate-with column there is performance event that we can use to locate exact place in the code where the issue occurs. For DRAM_Bound metric we should use MEM_LOAD_RETIRED.L3_MISS_PS precise event. Let’s sample on it:
$ perf record -e cpu/event=0xd1,umask=0x20,name=MEM_LOAD_RETIRED.L3_MISS/ppp ./a.out
If you don’t understand the underlying mechanics of what we just did, I encourage you to read one of my previous posts: Basics of profiling with perf and Understanding performance events skid. Let’s look into the profile:
$ perf report -n --stdio
...
# Samples: 33K of event 'MEM_LOAD_RETIRED.L3_MISS'
# Event count (approx.): 71363893
#
# Overhead       Samples  Command  Shared Object      Symbol
# ........  ............  .......  .................  ................................
#
    99.95%         33811  a.out    a.out              [.] foo                      <==
     0.03%            52  a.out    [kernel.kallsyms]  [k] get_page_from_freelist
     0.01%             3  a.out    [kernel.kallsyms]  [k] free_pages_prepare
     0.00%             1  a.out    [kernel.kallsyms]  [k] free_pcppages_bulk
All L3 misses are caused by our code. Let’s drill down to assembly:
$ perf annotate --stdio -M intel foo
Percent |      Source code & Disassembly of a.out for MEM_LOAD_RETIRED.L3_MISS
-------------------------------------------------------------------------------
         :      Disassembly of section .text:
         :
         :      0000000000400a00 <foo>:
         :      foo():
    0.00 :        400a00:       nop    DWORD PTR [rax+rax*1+0x0]
    0.00 :        400a08:       nop    DWORD PTR [rax+rax*1+0x0]
                  ...
    0.00 :        400df0:       nop    DWORD PTR [rax+rax*1+0x0]
    0.00 :        400df8:       nop    DWORD PTR [rax+rax*1+0x0]
    0.00 :        400e00:       mov    rax,QWORD PTR [rdi]
    0.00 :        400e03:       mov    rax,QWORD PTR [rdi+0xa]
  100.00 :        400e07:       mov    rax,QWORD PTR [rdi+rsi*1]   <==
    0.00 :        400e0b:       mov    rax,QWORD PTR [rdi+rax*1]
    0.00 :        400e0f:       mov    rax,QWORD PTR [rdi+0x14]
    0.00 :        400e13:       xor    rax,rax
    0.00 :        400e16:       ret
Just out of curiosity I collected the number of L3 misses:
$ perf stat -e cpu/event=0xd1,umask=0x20,name=MEM_LOAD_RETIRED.L3_MISS/ ./a.out
          71370594      MEM_LOAD_RETIRED.L3_MISS
It shows that 7 out of each 10 iterations had loads that missed in L3.
Now that we know what instructions caused so many L3 misses let’s fix it.
Fixing the issue
Let’s look at the code:
extern "C" { void foo(char* a, int n); }

const int _200MB = 1024*1024*200;

int main() {
  char* a = (char*)malloc(_200MB); // 200 MB buffer
  ...
  for (int i = 0; i < 100000000; i++) {
    int random_int = distribution(generator);
    foo(a, random_int);
  }
  ...
}
I allocate a big enough array to make it not fit in the L3 cache (L3 cache on the machine I was using is 38,5 MB - Intel(R) Xeon(R) Platinum 8180 CPU). Inside foo function (written in assembly in order to avoid compiler optimizations) I’m reading random memory location:
foo:
One_KB_of_nops		# emulate some irrelevant work

mov     rax, QWORD [rdi + 0]   # constant load
mov     rax, QWORD [rdi + 10]  # constant load

mov     rax, QWORD [rdi + rsi] # load that goes to DRAM
mov     rax, QWORD [rdi + rax] # introduce dependency chain

mov     rax, QWORD [rdi + 20]  # constant load
You probably already guessed what we should do. Yes, it’s prefetching. Because there is some significant time between the moment we get the next address we will read and actual load instruction, we can add prefetch hint (more details about __builtin_prefetch here):
  for (int i = 0; i < 100000000; i++) {
    int random_int = distribution(generator);
+   __builtin_prefetch ( a + random_int, 0, 1);
    foo(a, random_int);
  }
Code samples can be found on my github.
This hint improved execution time by 2 seconds (+30% speedup):
       24621931288      cycles
        2069238765      CYCLE_ACTIVITY.STALLS_L3_MISS
           8889566      MEM_LOAD_RETIRED.L3_MISS
       6,498080824 seconds time elapsed
Notice 10x less values for CYCLE_ACTIVITY.STALLS_L3_MISS and MEM_LOAD_RETIRED.L3_MISS. However, it didn’t fully go away. There is one technique based on using LBR that can help us to estimate our prefetch window. If there will be interest in it I can write additional post about it. Just leave a comment if you interested. UPD 3rd April 2019 I wrote this article: Precise timing of machine code with Linux perf.
Remember that TMAM is an iterative process, so we now need to repeat the process from the step #1. Likely it will move the bottleneck into some other bucket, probably Retiring. Ideally we want to be 100% bound by Retirement. Most of the time that means good thing, however not always. There are situations when you have very high retirement, but still app performs slow. This usually happens when Microcode sequencer starts feeding uops to the pipeline, like shown here.
Additional resources and links:
- Recording of the presentation made by the author of TMAM.
- Andi Kleen’s blog - pmu-tools, part II: toplev.
- Toplev manual - very nice description of TMAM.
- Intel® VTune™ Amplifier has built-in support ofr TMAM - Understanding How General Exploration Works in Intel® VTune™ Amplifier
All content on Easyperf blog is licensed under a Creative Commons Attribution 4.0 International License