Visualizing Performance-Critical Dependency Chains.
11 May 2022
Subscribe to my newsletter, support me on Patreon or by PayPal donation.
Due to the nature of my work as a performance engineer, I analyze CPU performance on various general-purpose applications: data compression, audio/video codecs, office productivity tools, etc. There is one common thing I found in all of them. They all have performance-critical dependency chains. I frequently spend a significant amount of time trying to find the critical data dependency chain that is limiting performance of an application.
In this post I will:
- Prove that critical data dependency chains are increasingly becoming the only thing that matters for performance of a general-purpose application.
- I will show how to find them using CPU pipeline diagrams.
- Share my proposal on how to visualize critical dependency chains in your favorite performance analysis tool.
Let’s go!
Motivation
It is always a good idea to start fairly high level, so let me give you an example. If you consider ANY general-purpose program, you will find that many operations are dependent on previous operations. In fact, it is a dependency graph. Here is what such a graph may look like for the automated system handling CI/CD jobs:
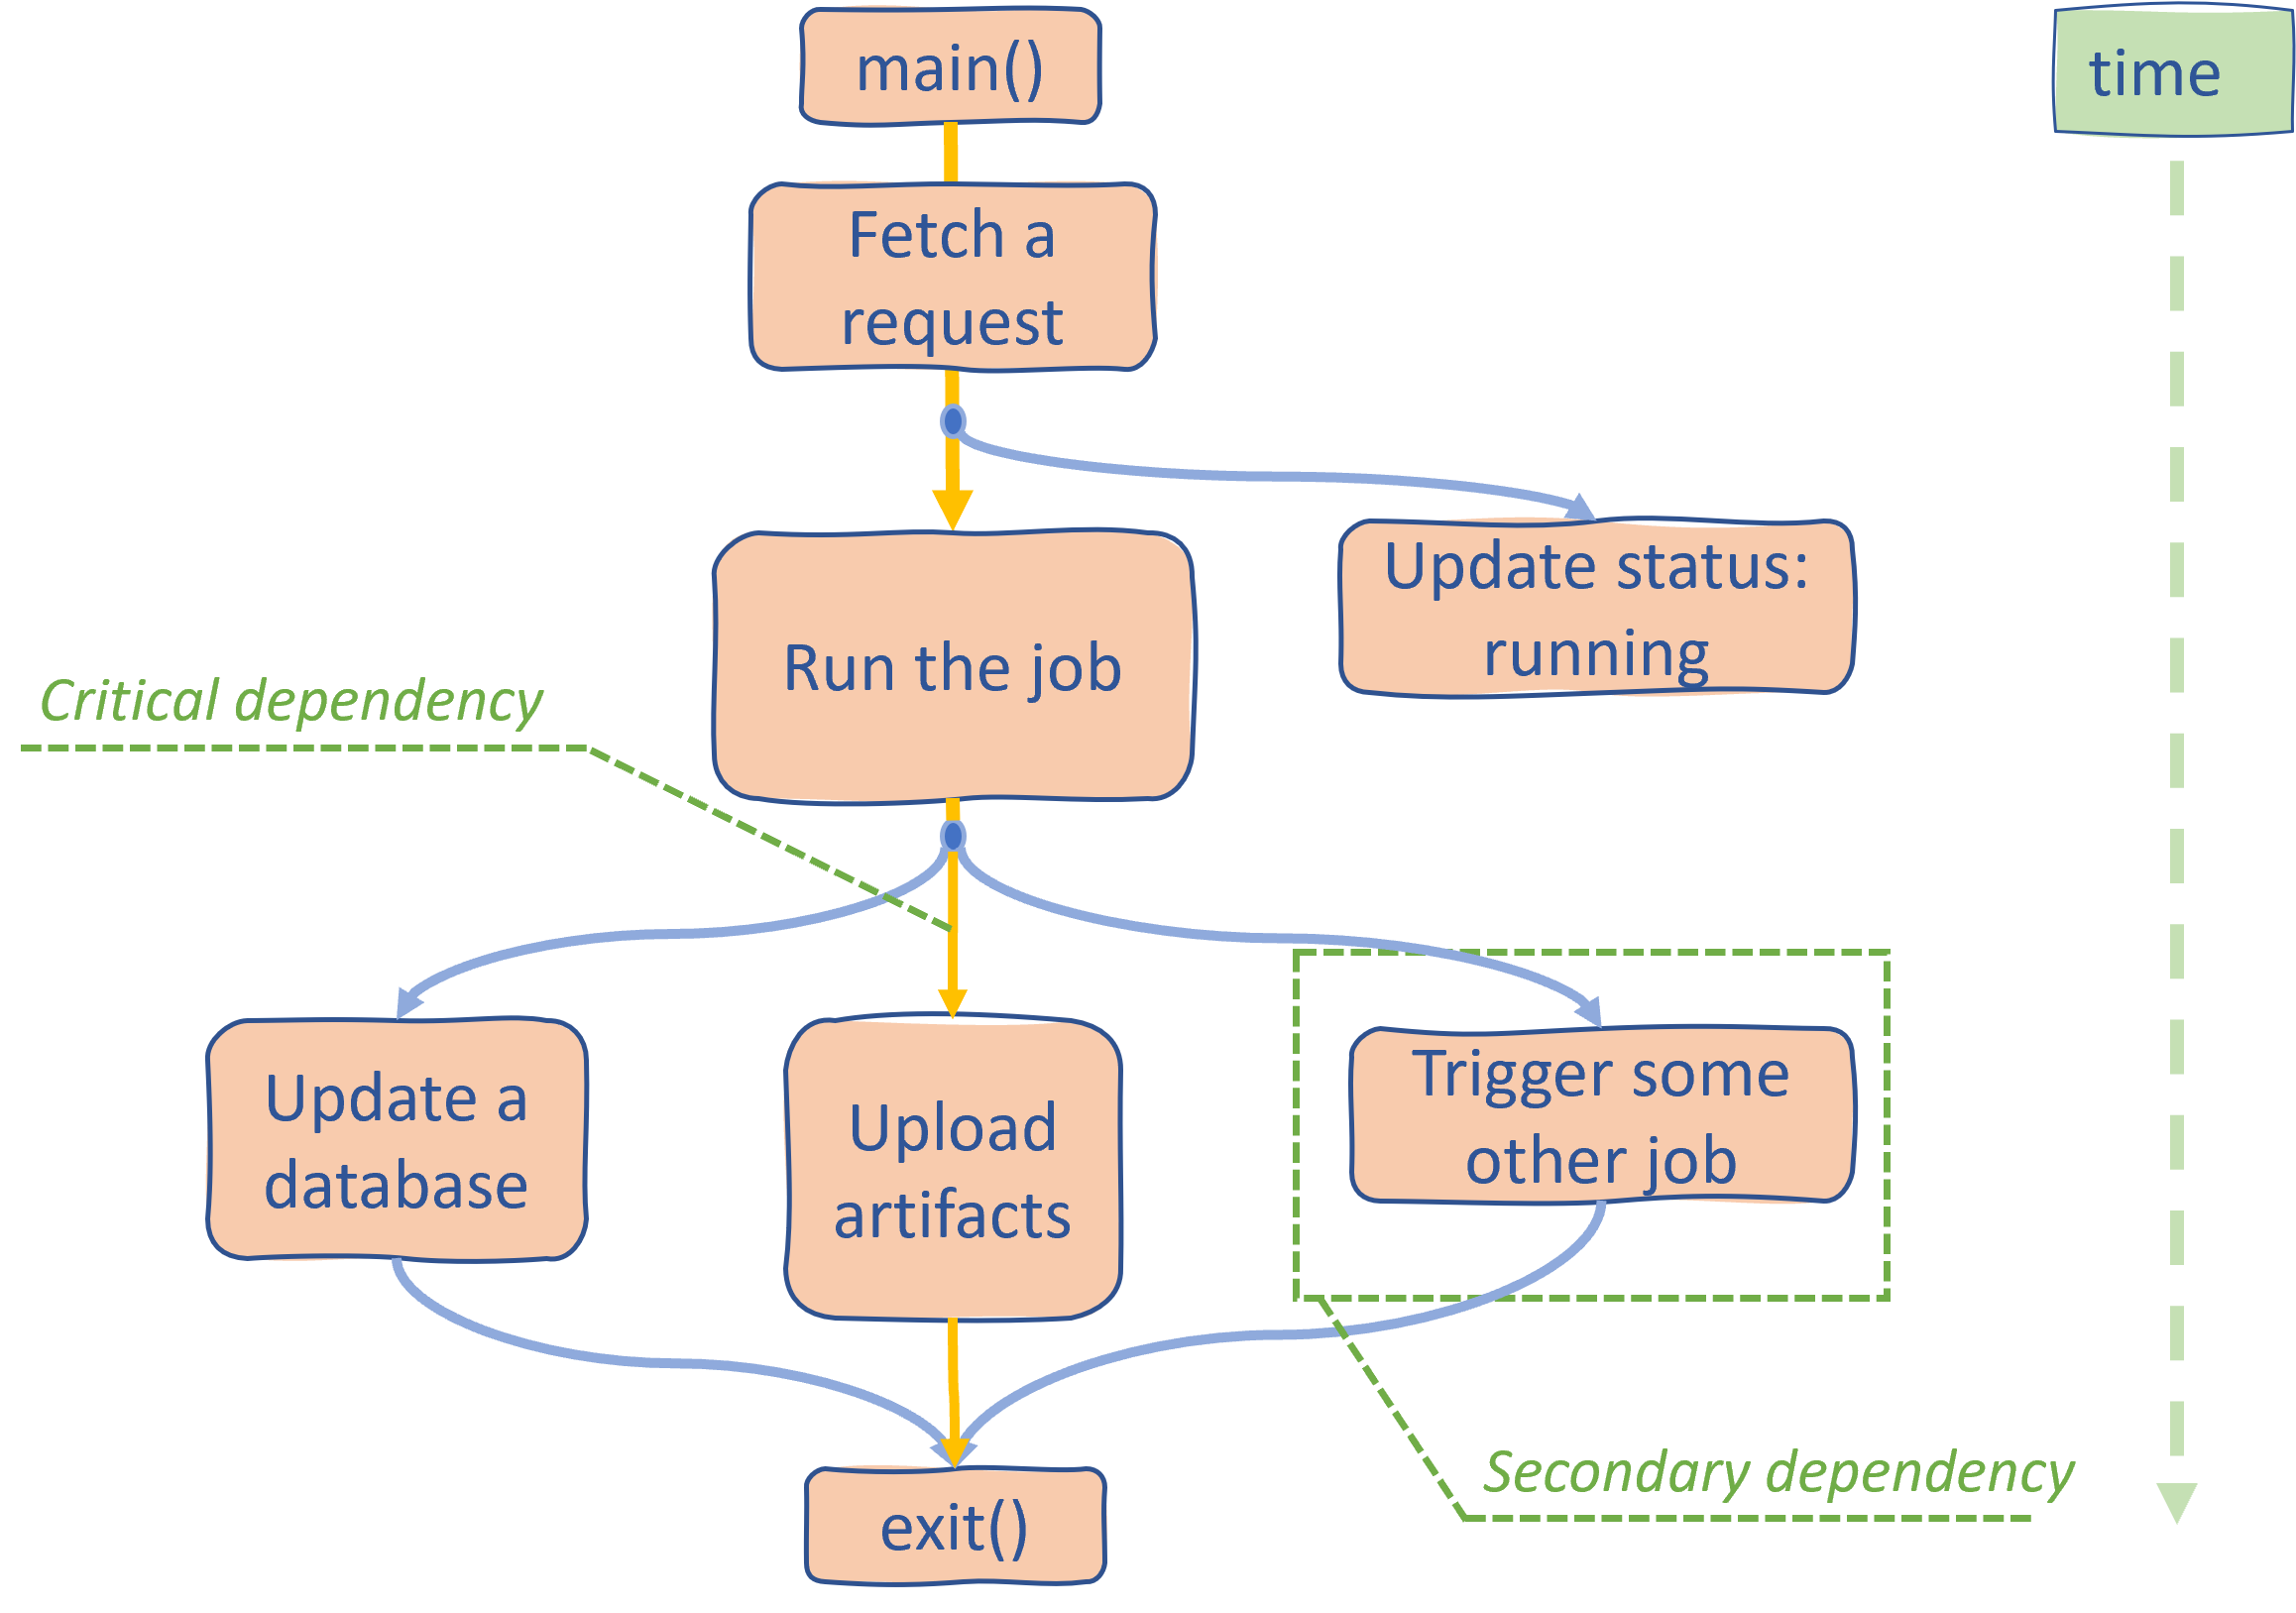
As you can see, there are many dependency chains that branch off from every operation. For a program to finish all the operations need to be executed, but not all of them strictly impact performance. For instance, we can update a database and upload artifacts in parallel, but the latter operation takes more time to finish.
Now, even if we somehow improved the speed of updating a database, it would not improve the overall performance since the program will only end when uploading artifacts is finished. Another interesting observation is that we could probably run a lot more operations in parallel with uploading artifacts, and it will not degrade the overall performance. The latter is only true to the extent that our HW is capable of providing the required execution throughput.
To some degree, execution throughput is not a real limitation like data dependency. Theoretically, we can always add more execution power (CPU cores, memory channels, etc.) to satisfy the hungriest number-crunching algorithm. Modern systems are becoming much more capable of doing work in parallel – the number of CPU cores in laptops and servers is growing at a steady pace. I’m not saying execution throughput is not a real performance bottleneck. There are many scientific, and other massively parallel applications that stress the machine throughput and require significant execution power. It’s just that data dependency is more fundamental.
Given that, for a general-purpose application, it is only the longest dependency chain (trunk of the tree) that defines performance of our program. All the secondary computations (branches of the tree) are becoming less relevant. Probably nothing new for you. But I told you it was a high-level introduction, right? Now let’s go several levels down the SW stack… directly to the assembly level.
CPU core level
As the number of CPU cores grows, so does an individual CPU core get more parallelism in it. Another way of saying this is they’re becoming “wider”1. It means that the individual core is designed to do more operations in a single CPU cycle. Again, the idea is the same: we want to have enough execution throughput in every core so that the secondary computations do not interfere with the operations on the critical path. How can they interfere? Well, they can occupy execution ports and do not allow instructions on the critical path to get access to the resources on time (example follows). Remember, a delay on the secondary dependency chain does not necessarily affect performance, but a delay on a critical path ALWAYS prolongs the entire program.
Consider a hypothetical algorithm, which has a dependency graph that is shown below. Take your time to look at it. I know this can be confusing, for example, “Why STOREs are not on the critical path?”. Backward jump (CMP+JMP) is also not on the critical path if it can be predicted well. If you struggle to understand it, I strongly recommend you read this awesome blog post by Fabian Giesen. Study it carefully, you will become much better at identifying critical paths through your algorithms.
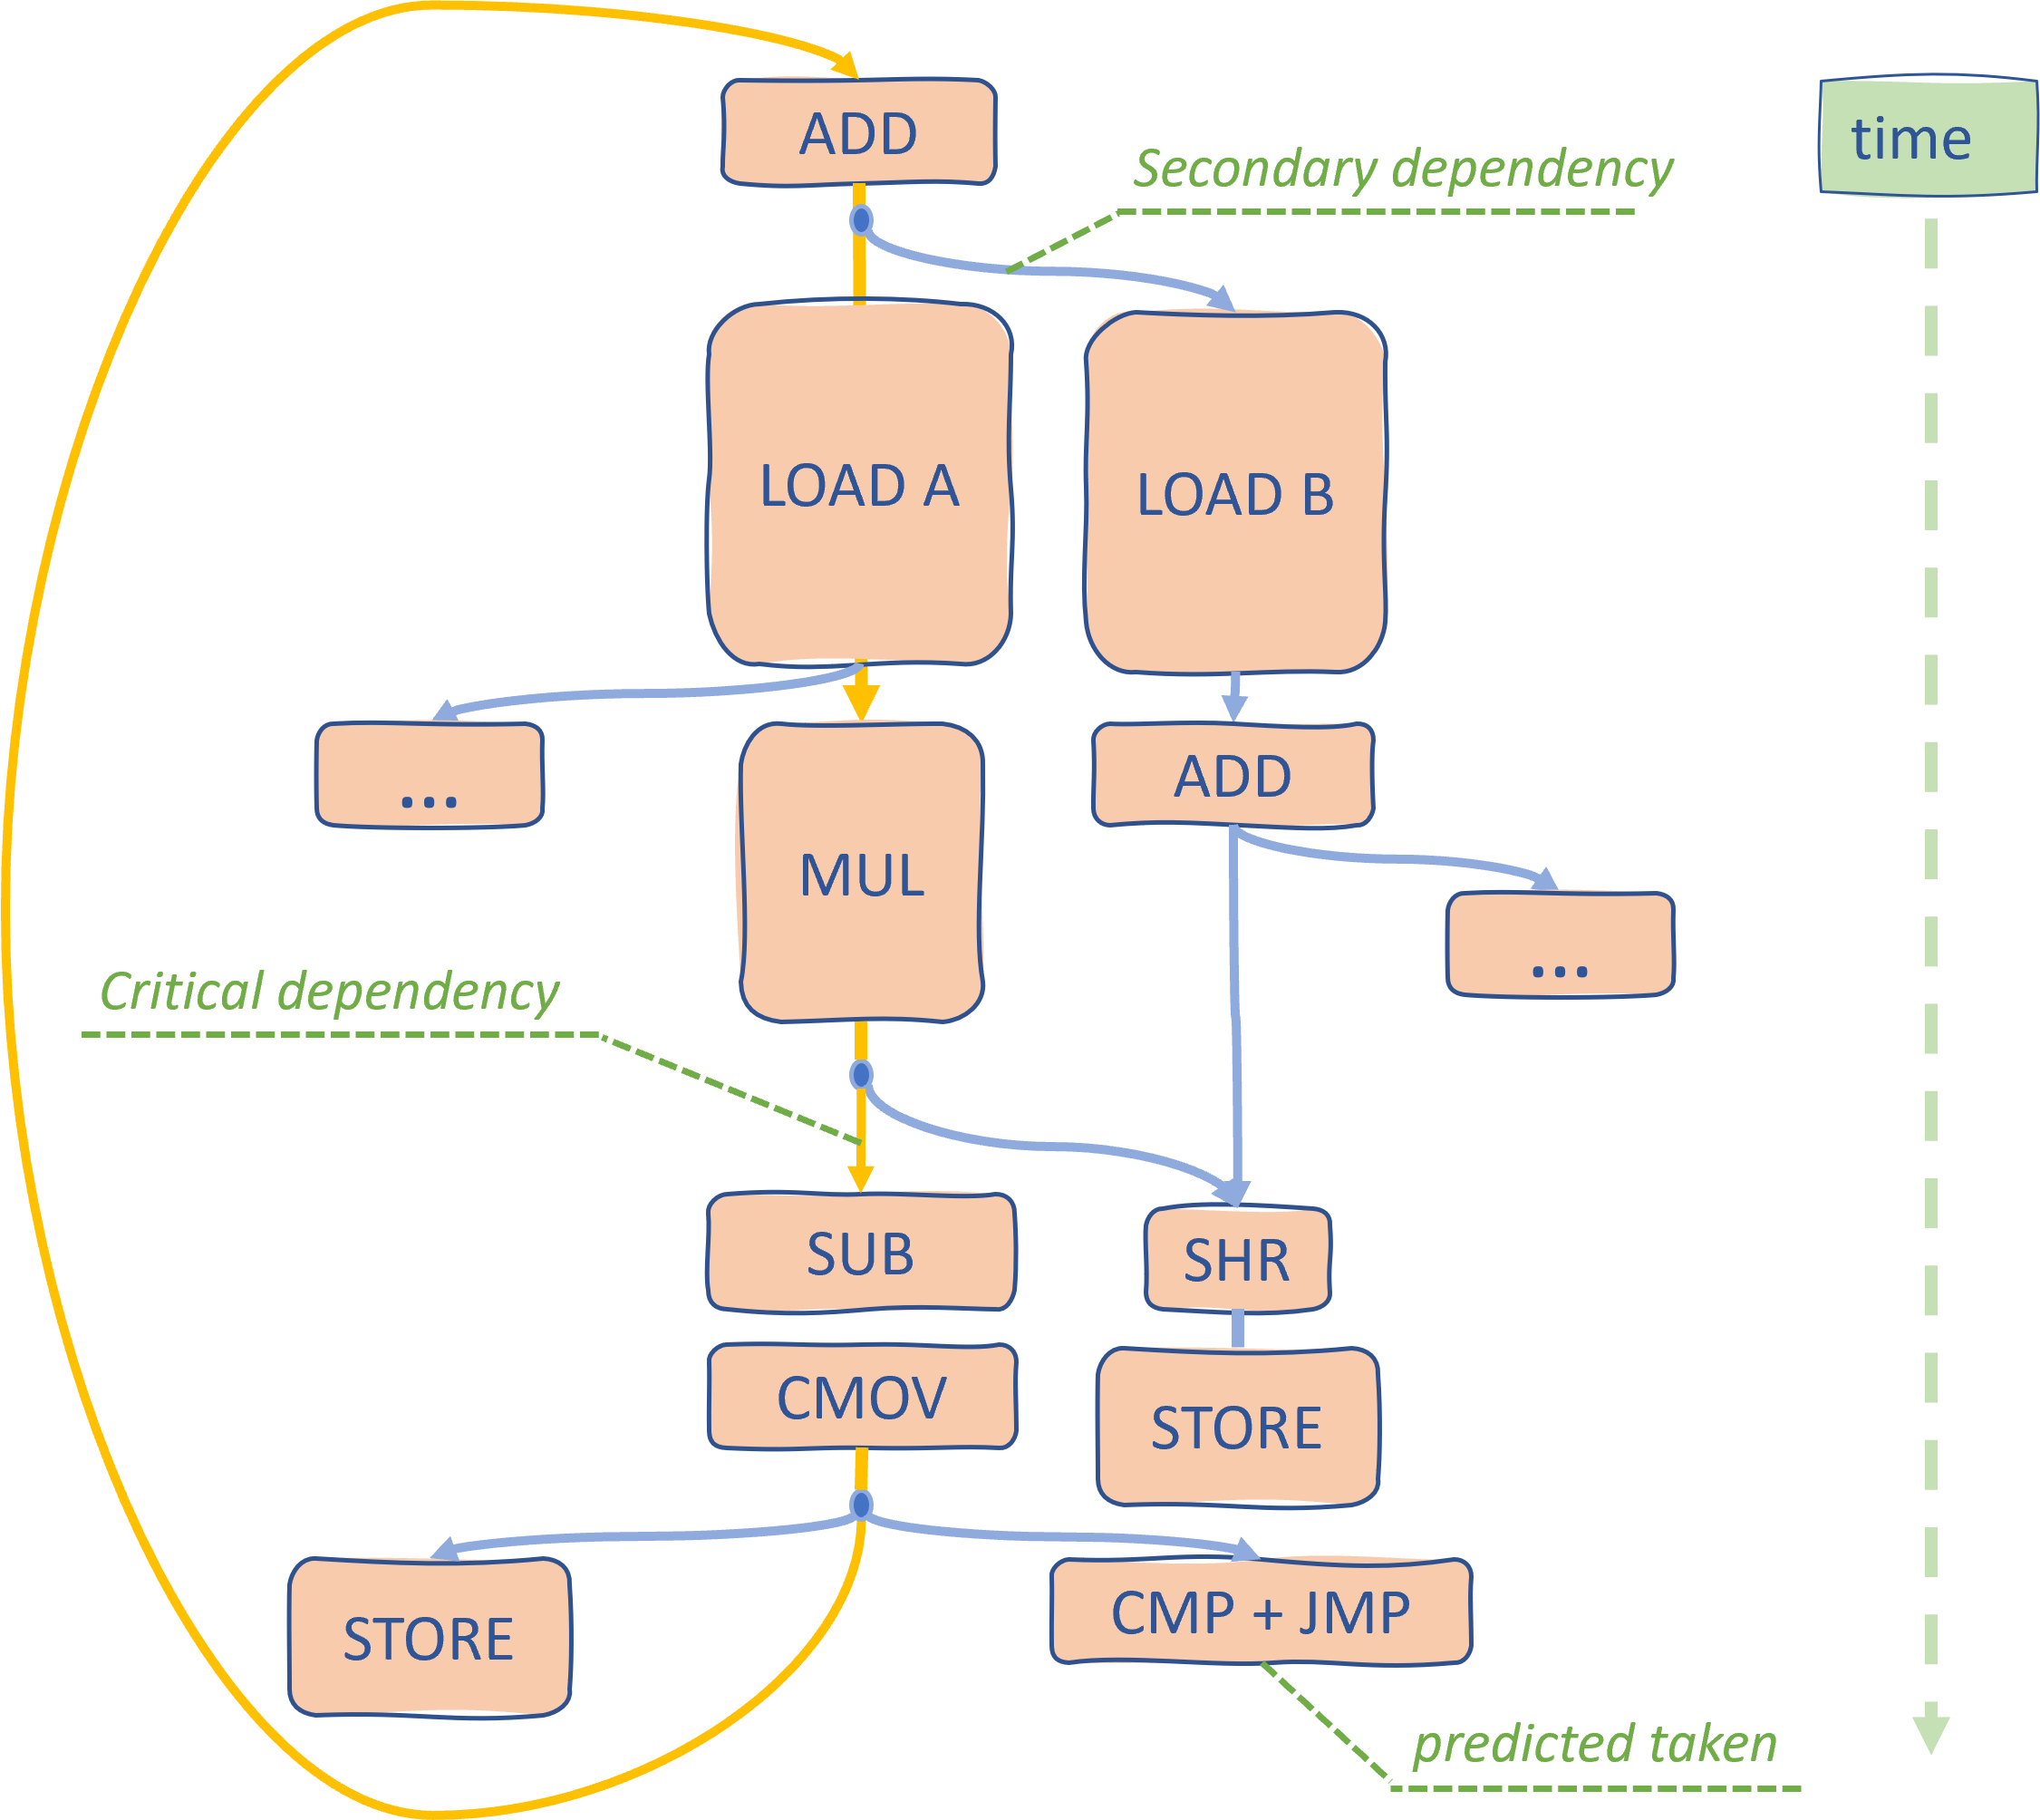
Consider instructions SUB and SHR. They are executed in parallel, but one is on the critical path, while another is not. If you would only have one execution port for SUB or SHR, what would you schedule first? It’s obvious that it should be SUB since it’s on the critical path. It may not be so obvious for a CPU though. If we have multiple operations competing for the same execution resources, not choosing critical instructions first may lead to performance penalties. Luckily, cores are getting wider, and this becomes an issue less frequently.
Also, I left placeholders with three dots … just to show that there could be other operations that branch off and form new dependency graphs. But then again, having a very wide machine makes them essentially free. As a CPU design goal, on one hand, a narrow machine will let secondary operations create a roadblock for the critical path. On the other hand, having a 100-wide machine probably doesn’t make sense as there are no general purposes algorithms with so much instruction-level parallelism (ILP).
Intermediate summary: because modern CPUs are becoming wider and wider, computations on secondary dependency chains are becoming less relevant, and rare is the source of performance bottlenecks. For me as a performance engineer, it’s crucial to find the critical path since everything else doesn’t matter much. Knowing which sequence of operations constitutes a critical path is super important since you know what should really be optimized and how much headroom you have.
I hope that by now I proved to you the importance of identifying the critical path in your program. Let’s see how we can find it.
How to find dependency chains?
Improving the speed of performance-critical pieces of code sometimes requires looking at CPU pipeline diagrams. This is what extreme tuning means! If you see it the first time, this wikipedia page might be a good starting point. It could be hard at first, but after some time you’ll be able to see patterns, I promise 😊.
UICA is one of the leading open-source tools for visualizing CPU pipeline diagrams. Shoutout to the authors, they’ve done a great job2! For illustrating my idea, I took the stock UICA code sample that looks like this (don’t try to extract the semantic meaning from this code, there is none – it’s synthetic):
loop:
add rax, [rsi]
adc rax, [rsi+rbx]
shld rcx, rcx, 1
shld rcx, rdx, 2
dec r15
jnz loop
Exercise: try to find a critical path through this piece of code before reading the rest of the article.
The CPU pipeline diagram below shows the execution of the first three iterations of the loop for the still-very-wide-spread Intel Skylake core. It shows how instructions progress over time. Modern superscalar CPUs can operate on different parts of different instructions in parallel. This is what’s shown on the diagram – several instructions can be in the execute stage at the same time. Notice that instructions from different iterations can also be executed in parallel. CPU effectively unrolls execution of the loop internally.

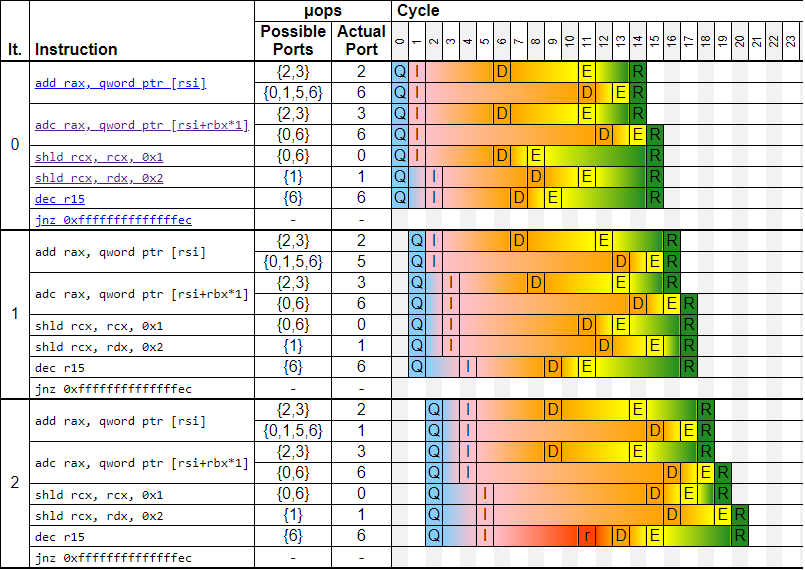
You can generate a similar trace if you use this link or go to UICA and plug the code above. I will not spend much time talking about this particular diagram – I’m only showing it in case you’ve never seen them before. And even if you have experience in analyzing those, I recommend you skip the first 10-20 iterations to the place where execution reaches a steady state. Let’s take a look at iterations 14 and 15 below:
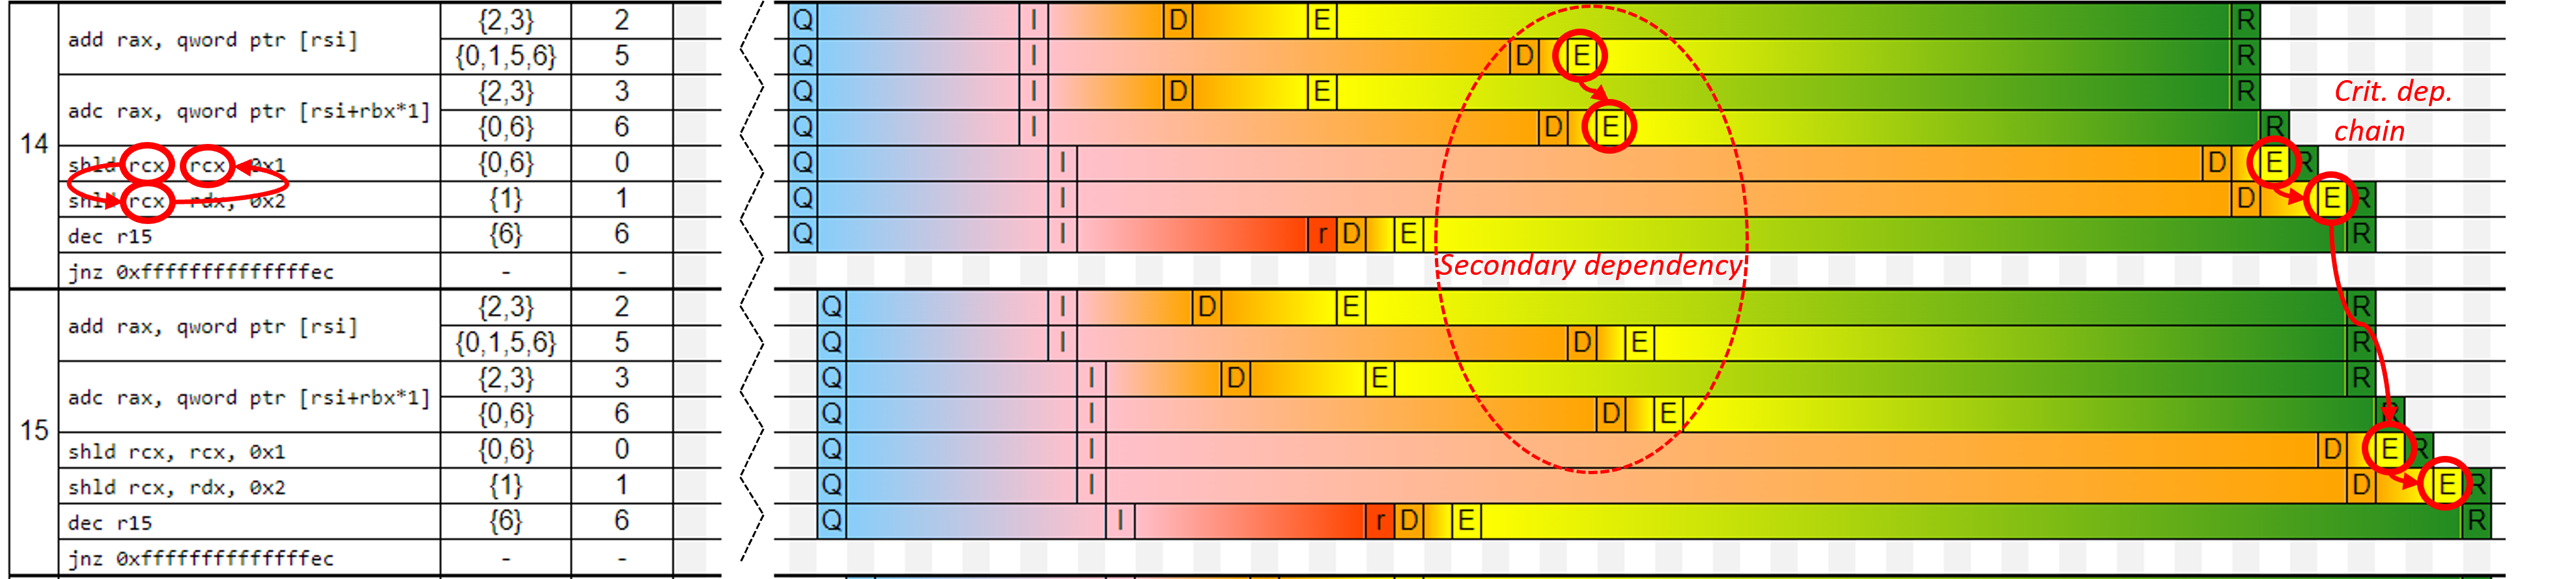
This is where things are starting to crystalize. Some instructions are executed much earlier than others. Those are instructions on a secondary dependency chain (ADD -> ADC). Remember, the front end (fetching instructions) and retirement (commit results) stages are done “in-order”, while execution can be done “out-of-order”. Notice that instructions on a secondary dependency chain sit inside the machine, having their results ready to be committed, yet they must wait until the preceding instructions retire.
On the other hand, instructions SHLD -> SHLD form a critical dependency chain, which has a latency of 4 cycles per iteration. The distance between execution (E) and retirement (R) stages for critical dependency chains is very small 3 compared to the secondary dependency chain. We will use this later.
Question: is it possible that ADD->ADC would become a critical dep chain? Under which circumstances?
After looking at dozens of such diagrams, I began thinking: “Is it possible for a performance analysis tool to highlight critical dependency chains?” Yes, you can plug a hot loop into a tool like UICA, simulate it, and see where your critical path is. However, I don’t think this is a good solution for the 2 primary reasons: 1) it takes developer time, and 2) UICA is still an oversimplified model of a real CPU design.
So, can we teach your favorite performance profiler to highlight critical dependency chains? It is not a simple task, but I think it may be possible. Next, I share some initial thoughts on how to approach this problem.
My proposal
So far, we figured out that instruction that is on a critical path must 1) have a low E->R distance, and 2) have a high execution count.
I think that HW support is required to achieve the goal. CPU needs to keep track of the distance between the execution (E) and retirement (R) stages for a number of hot instructions. Example of an internal table that a CPU can maintain:
| Instruction | Average | Execution |
|---|---|---|
| address | E->R distance |
count |
| 0xfffffffffffff1ee | 1.05 | 125 |
| 0xfffffffffffff1e2 | 1.07 | 125 |
| 0xfffffffffffff1e8 | 10.13 | 125 |
| … | … | … |
A sampling profiler, e.g. Linux perf, can later dump that table from the CPU with every collected sample. After profiling finishes, some postprocessing can be done to aggregate collected data. I don’t have an exact postprocessing algorithm in mind though. Some thoughts:
- When dealing with several hot loops, some clustering is needed first, i.e. finding distinct dependency chains.
- We need to filter instructions with low execution count or high
E->Rdistance. - Once we’ve done that filtering, we need to disassemble instructions at the top of the table (that likely sit on a critical path) and figure out dependencies between them (which could be tricky). Alternatively, we could simply highlight the instructions and leave it up for a developer. This already would be valuable information for a performance engineer.
Some interesting cases:
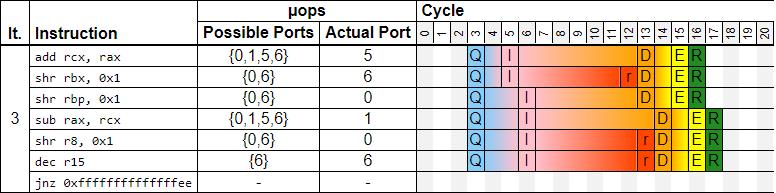
1) This information may also be useful if we are bound by execution throughput.
In this example, there are no data dependencies. Instead, we are bound by the execution throughput of ports 0 and 6. Both SHR and DEC + JNZ instructions occupy those two ports. The approach I described above will highlight those two instructions since they have the smallest E->R distance.
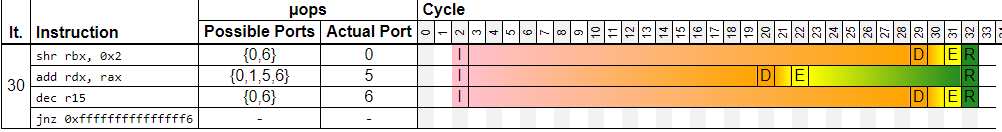
2) When we are equally bound by a dependency chain and execution throughput:
In this example, we have 4 instructions that compete for ports 0 and 6, which limits the throughput to one iteration every two cycles. And, we have a data dependency ADD -> SUB, which also has a latency of 2 cycles. Hopefully, the Skylake core is wide enough to handle both in 2 cycles per iteration.
For such a scenario, it would be good to highlight those two groups of instructions using different colors. SW post-processing algorithm then would need to find independent instructions and group them together (stress execution throughput). What remains is the critical dependency chain.
3) Capturing very long dependency chains may be problematic. Since the HW internal table capacity is finite, there will be cases when the entire dependency chain will not fit into that table. For now, it probably only makes sense for small and medium loops (up to a hundred instructions).
All in all, I didn’t spend too much time digging into that idea. Prototyping it with UICA seems like a reasonable way to proceed. I would love to hear your feedback!
I think that if you adopt thinking in terms of critical dependency chains, you will be able to reason about performance of a certain piece of code much better.
Footnotes:
-
For example, the width of the still-very-wide-spread Skylake core is 4. Does it always mean a wider core is more performant? - No. But making a core wider requires a lot of silicon and it complicates the design. You see, you cannot just add more execution ports, you need to keep the machine balanced. ↩
-
Modern performance simulators that mimic the operation of a REAL processor are of course much more involved. They have more pipeline stages than shown by UICA and much more events that can explain, for example, why a certain instruction was stalled at a particular cycle. Of course, those simulators are proprietary since it is a critical intellectual property. It is an SW model of an entire CPU microarchitecture. ↩
-
People sometimes say that instructions on a critical path are “pushing the retirement”, which is true if you look at the diagram. ↩
All content on Easyperf blog is licensed under a Creative Commons Attribution 4.0 International License