Machine code layout optimizations.
27 Mar 2019
Contents:
- What is machine code layout?
- Machine code layout optimizations
- Profile guided optimizations (PGO)
- Summary
Subscribe to my newsletter, support me on Patreon or by PayPal donation.
I spent a large amount of time in 2018 working on optimizations that try to improve layout of machine code. I decided to share what it is and show some basic types of such transformations.
I think usually those improvements are underestimated and usually end up being omitted and forgotten. I agree that you might want to start with “fruits that hang lower” like loop unrolling and vectorization opportunities. But knowing that you might get extra 5-10% just from better laying out the machine code is still useful.
Before actually going to the core of the article I should say that CPU architects put a lot of efforts in hiding those kind of problems that we will talk about today. There are different structures in the CPU front-end that mitigate code layout inefficiencies, however there is still no free lunch there.
Everything that we will discuss in this article applies whenever you see a big amount of execution time wasted due to Front-End issues. See my previous article about Top-Down performance analysis methodology for examples.
Compilers? Is that what you think? Right, compilers are very smart nowadays and are getting smarter each day. They do the most part of the job of generating the best layout for your binary. In combination with profile guided optimization (see at the end of the article) they will do most of the things that we will talk about today. And I doubt you can do it better than PGO, however there are still some limitations. Keep on reading and you will know.
If you just want to refresh knowledge in your head, you can jump straight to summary.
What is machine code layout?
When compiler translates your source code into zeros and ones (machine code) it should generate serial byte sequence. For example, it should convert this C code:
if (a <= b)
  c = 1;
Into something like:
; a is in rax
; b is in rdx
; c is in rcx
cmp rax, rdx
ja .label
mov rcx, 1
.label:
Assembly instructions will be encoded with some amount of bytes and will be laid out consequently in memory. This is what is called machine code layout.
Next I will show some typical optimizations of code layout in the order of biggest impact it can make1.
Machine code layout optimizations
Basic block placement
If you’re unfamiliar with what is Basic block, it is a sequence of instructions with single entry and single exit:
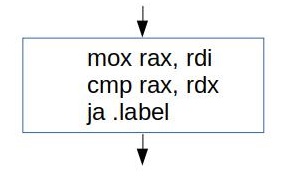
Compilers like to operate on a basic block level, because it is guaranteed that every instruction in the basic block will be executed exactly once. Thus for some problems we can treat all instructions in the basic block as one instruction. This greatly reduces the problem of CFG (control flow graph) analysis and transformations.
All right, enough theory. Why one sequence of blocks might be better than the other? Here is the answer. For the code like this:
// hot path
if (cond)
  coldFunc();
// hot path again
Here are two different physical layouts we may come up with:
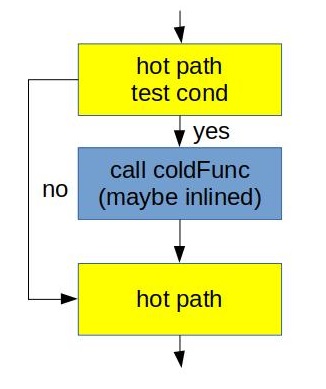

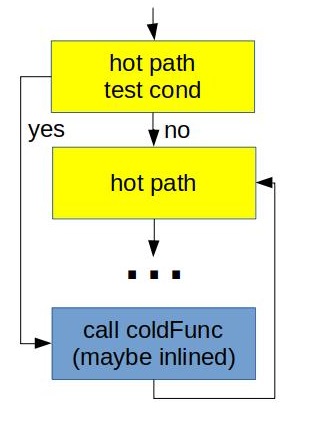
What we did on the right was just invert the condition from if (cond) into if (!cond). Arrow suggests that the one on the right is better than the one on the left. But why? Main reason is because we maintain fall through between hot pieces of the code. Not taken branches are fundamentally cheaper that taken. Additionally second case better utilizes L1 I-cache and uop-cache (DSB). See one of my previous posts for further details.
You can make a hint to compiler using __builtin_expect construct2:
// hot path
if (__builtin_expect(cond, 0)) // NOT likely to be taken
  coldFunc();
// hot path again
When you dump assembly you will see the layout that looks like on the right.
In LLVM this functionality is implemented in lib/CodeGen/MachineBlockPlacement.cpp based on lib/Analysis/BranchProbabilityInfo.h and lib/Analysis/BlockFrequencyInfoImpl.cpp. It is very educational to browse through the code and see what heuristics are implemented there. There are also hidden gems implemented in MachineBlockPlacement.cpp like, for example, rotating blocks of the loop. It’s not obvious at a glance why it is done and there is no explanation in the comments either. I learned why we need it the hard way after disabling it and look at the result. I might write a separate article on that topic.
Facebook in the mid 2018 open-sourced their great peace of work called BOLT (github). This tool works on already compiled binary. It uses profile information to reorder basic blocks within the function3. I think it shouldn’t be too hard to integrate it in the build system and enjoy the optimized code layout! The only thing you need to worry about is to have representative and meaningful workload for collecting profiling information, but that a topic for PGO which we will touch later.
Basic block alignment
I already wrote a complete article on this topic some time ago: Code alignment issues. This is purely microarchitectural optimization which is usually applied to loops. Figure below is the best brief explanation of the matter:


Idea here is that shift the hot code (in yellow) down using NOPs (in blue) so that the whole loop will reside in one cache line. On the picture below cache line start from c0 and ends at ff. This transformation usually improves I-cache and DSB utilization.
In LLVM it is implemented in the same file as basic block placement algorithms: lib/CodeGen/MachineBlockPlacement.cpp, look at MachineBlockPlacement::alignBlocks(). This topic was so popular that I wrote also article that describes compiler different options in LLVM to manually control alignment of basic blocks: Code alignment options in llvm.
For experimental purposes it is also possible to emit assembly listing and then insert NOP instructions or ALIGN4 assembler directives:
; will place the .loop at the beginning of 256 byte boundary
ALIGN 256
.loop
  dec rdi
  jnz rdi
Function splitting
The idea of function splitting is to separate hot from cold code. This usually improves the memory locality of the hot code. Example:
void foo(bool cond1, bool cond2) {
  // hot path
  if (cond1)
    // cold code 1
  //hot code
  if (cond2)
    // cold code 2
}
We might want to cut cold part of the function into it’s own new function and put a call to it instead. Something like this:
void foo(bool cond1, bool cond2) {
  // hot path
  if (cond1)
    cold1();
  //hot code
  if (cond2)
    cold2();
}

void cold1() __attribute__((noinline)) { // cold code 1 }
void cold2() __attribute__((noinline)) { // cold code 2 }
This is how it looks in the physical layout:
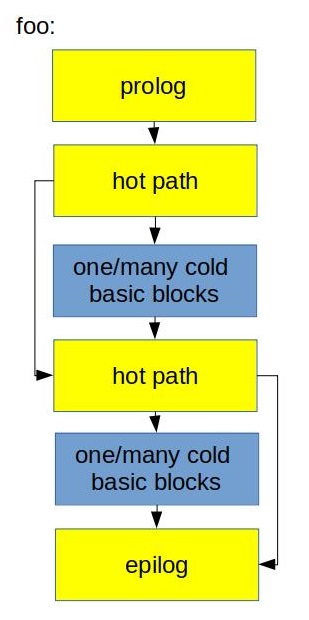

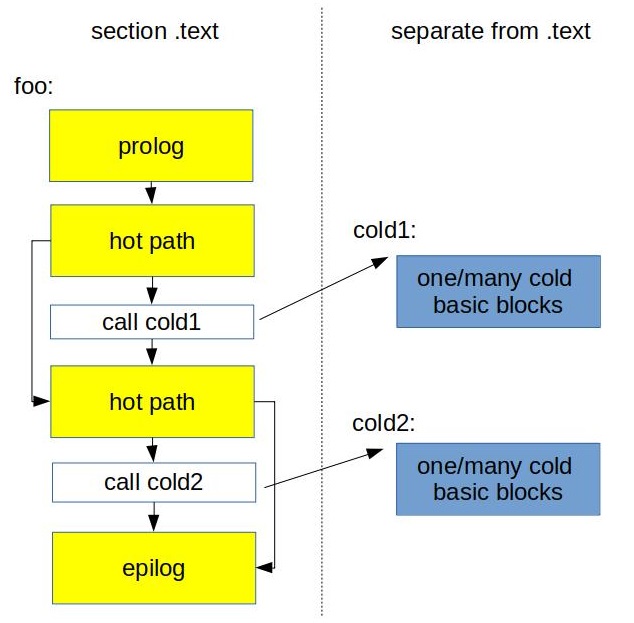
Because we just left the call instruction inside the hot path it’s likely that next hot instruction will reside in the same cache line. This improves utilization of CPU Front-End data structures like I-cache and DSB-cache.
This transformation contains another important idea which is disable inlining of cold functions. You see how we forbid inlining of cold1 and cold2 functions above? The same applies when you see a lot of cold code that appeared after inlining some function. You don’t need to split it into new function, just disable inlining of this function.
Typically we also would like to put cold code into subsection of .text or even into a separate section.
This optimization is beneficial for relatively big functions with complex CFG where there are big pieces of cold code inside hot path, for example, switch statement inside the loop.
There is implementation of this functionality in LLVM that resides in lib/Transforms/IPO/HotColdSplitting.cpp. Last time5 I analyzed it wasn’t able to do much with really complicated CFGs, but the work is under development, so I hope it will be better soon.
Function grouping
Usually we want to place hot functions together such that they touch each other in the same cache line.
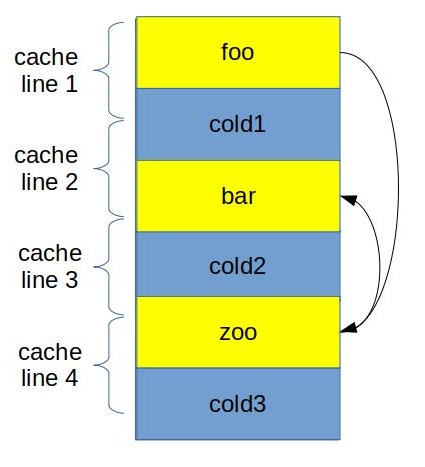

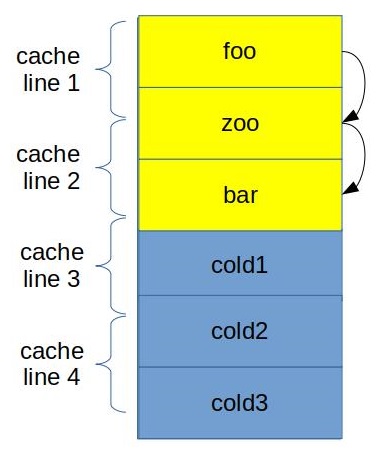
In the figure above you can see how we grouped foo, bar and zoo in such a way that now their code fits in only 3 cache lines. Additionally when we call zoo from foo, beginning of zoo is already in the I-cache, since we fetched that cache line already. Similar to previous optimizations here we try to improve utilization of I-cache and DSB-cache.
This is rather the job for the linker, because it has a power of placing functions in executable. In gold linker it can be done using –section-ordering-file option.
This optimization works best when there are many small hot functions.
There is also very cool tool for doing this automatically: hfsort. It uses linux perf for getting profile information, then it does it’s ordering magic and gives the text file with optimized function order which you can then pass to the linker. Here is the whitepaper if you want to read more about the underlying algorithms.
Profile guided optimizations (PGO)
It is usually the best option to use PGO if you can come up with a typical scenario for your application. Why that’s important? Well, I will explain shortly.
Compiling a program and generating assembly is all about heuristics. You will be surprised how much uncertainty there is inside every good optimizing compiler, like LLVM. For a lot of decisions compiler makes it tries to guess the best solution based on some typical cases. For example, should I inline this function? But what if it is called a lot of times? In this case I probably should do it, but how do I know that beforehand?
Here is when profiling information becomes handy. Given profiling information compiler doesn’t need to question what should be the decision. And often times you will see in compiler implementation the pattern like:
if (profiling information available)
  make decision based on profiling data
else
  make decision based on heuristics
Keep in mind that compiler “blindly” uses the profile data you provided. What do I mean by that is compiler assumes that all the workloads will behave the same, so it optimizes your app just for that single workload. So be careful with choosing the workload to profile, because you can make things even worse.
I must say that it shouldn’t be exactly single workload since you can merge multiple profile data into single file.
I’ve seen real workloads that were improved up to 15% from profile guided optimizations. PGO does not only improve code placement, but also improve register allocation, because with PGO compiler can put all the hot variables into registers, etc. The guide for using PGO in clang is described here.
Summary
| How transformed? | Why helps? | Works best for | Done by | |
|---|---|---|---|---|
| Basic block placement | maintain fall through hot code | not taken branches are cheaper that taken; better caches utilization | any code, especially with a lot of branches | compiler |
| Basic block alignment | shift the hot code using NOPS | better caches utilization | hot loops | compiler |
| Function splitting | split cold blocks of code and place them in separate functions | better caches utilization | functions with complex CFG when there are big blocks of cold code between hot parts | compiler |
| Function grouping | group hot functions together | better caches utilization | many small hot functions | linker |
-
This is solely based on my experience and typical gains I saw. ↩
-
You can read more about builtin-expect here: https://llvm.org/docs/BranchWeightMetadata.html#builtin-expect. ↩
-
It also able to do function splitting and grouping. ↩
-
This example use MASM. Otherwise you will see
.aligndirective. ↩ -
I did it on December 2018. ↩
All content on Easyperf blog is licensed under a Creative Commons Attribution 4.0 International License