Code alignment issues.
18 Jan 2018
Contents:
- Introduction
- Numbers
- Let’s try to understand why that happens.
- Code alignment matters
- To make things even more funny
- Collected performance counters
- Caveats
- Why not always align?
- Conclusions
Subscribe to my newsletter, support me on Patreon or by PayPal donation.
Introduction
How hard it is to benchmark the simple function like that?
// func.cpp
void benchmark_func(int* a)
{
	for (int i = 0; i < 32; ++i)
		a[i] += 1;
}
You just stick it into the microbenchmark, call it enough times to have sustainable results and report it, right? Well, yes we could also check the assembly to make sure nothing was optimized away. We can also collect profiles to see that our loop is the only hot spot in the benchmark. Kind of make sense. We know what we measure.
Let’s suppose that in your file there is one more function which you are also benchmarking but separately from the benchmark_func, like that:
// func.cpp
void foo(int* a)
{
	for (int i = 0; i < 32; ++i)
		a[i] += 1;
}

void benchmark_func(int* a)
{
	for (int i = 0; i < 32; ++i)
		a[i] += 1;
}
One day your manager comes to you angry with the numbers he received from the customers. The numbers are lower than you measured of course :).
Customer is only interested in benchmark_func, so he just sticked only this function into the microbenchmark (original version in the very beginning of the article).
Numbers
I compiled this code with recent clang (from 13.01.2018) with the options:
-O2 -march=skylake -fno-unroll-loops
I ran this on the Intel Core i7-6700 Skylake processor.
Full code along with building scripts are available here. Note, that you need google benchmark library to compile the code.
Let’s take the case with 2 function as a baseline and let’s call the case with only benchmark_func “no_foo”.
Here are the results:
$ ./baseline.sh
---------------------------------------------------------
Benchmark          CPU   Iterations  Throughput   Clockticks/iter
---------------------------------------------------------
func_bench_median  4 ns  191481954   32.5626GB/s  74.73
$ ./no_foo.sh
---------------------------------------------------------
Benchmark          CPU   Iterations  Throughput   Clockticks/iter
---------------------------------------------------------
func_bench_median  4 ns  173214907   29.5699GB/s  84.54
I calculated Clockticks/iter metric myself by dividing total number of clockticks for benchmark_func by the number of iterations.
Suddenly, just because I removed foo before(!) benchmark_func, performance goes down by ~10%.
Let’s try to understand why that happens.
Going ahead a little bit, for all examples that I will show the generated assembly for benchmark_func is identical with the only difference is it’s placement in the binary and internal loop alignment.
In order to understand this swing lets look at the dissassembled code for the baseline:
$ objdump -d a.out -M intel | grep "<_Z14benchmark_funcPi>:" -A15
00000000004046c0 <_Z14benchmark_funcPi>:
  4046c0:       48 c7 c0 80 ff ff ff    mov    rax,0xffffffffffffff80
  4046c7:       c5 fd 76 c0             vpcmpeqd ymm0,ymm0,ymm0
  4046cb:       0f 1f 44 00 00          nop    DWORD PTR [rax+rax*1+0x0]
  4046d0:       c5 fe 6f 8c 07 80 00    vmovdqu ymm1,YMMWORD PTR [rdi+rax*1+0x80]
  4046d7:       00 00
  4046d9:       c5 f5 fa c8             vpsubd ymm1,ymm1,ymm0
  4046dd:       c5 fe 7f 8c 07 80 00    vmovdqu YMMWORD PTR [rdi+rax*1+0x80],ymm1
  4046e4:       00 00
  4046e6:       48 83 c0 20             add    rax,0x20
  4046ea:       75 e4                   jne    4046d0 <_Z14benchmark_funcPi+0x10>
  4046ec:       c5 f8 77                vzeroupper
  4046ef:       c3                      ret
We can see that code is aligned at the i-cache line boundary (0x406c0 mod 0x40 == 0x0), that’s good. However there is something more we need to know about the Intel Architecture (IA) front-end.
For Skylake family there is MITE (Micro-instruction Translation Engine) which fetches instructions 16 bytes each cycle. Important note here is that those 16 bytes are always represent 16B aligned window, meaning you can’t fetch instructions from different 16B aligned windows. After we fetch the decoder decodes those instructions into the sequence of smaller operations (uops). And then it feeds them into the rest of the pipeline.
But also there is another HW unit called DSB (Decoded Stream Buffer), which is essentially the uops cache. If we want to execute something that was already executed before we first look into the DSB. If it happens to be there we are not fetching it from memory, we feed the back-end with already decoded uops. However there are some constraints about how uops can land in the DSB, we will discuss it further.
In the assembly above you can see that code was vectorized and there are only 4 iterations of the loop, which is good for this example, because otherwise the LSD (Loop Stream Detector) will spot the loop and stop fetching instruction from the memory.
More information about IA front-end is available in the “Intel 64 and IA-32 Architectures Optimization Reference Manual”. And also I want to share a presentation made by my colleague Zia Ansari from Intel at the LLVM dev meeting 2016. I strongly encourage the reader to take a break now a go watch at least this talk.
Code alignment matters
I think you already starting to understand where I’m going with this. So let me show you how benchmark_func is placed in the code for those two cases.
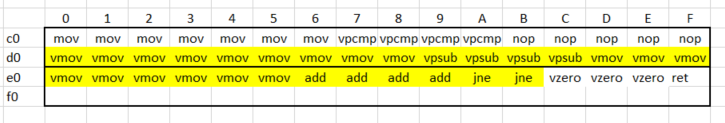
baseline:
no_foo:
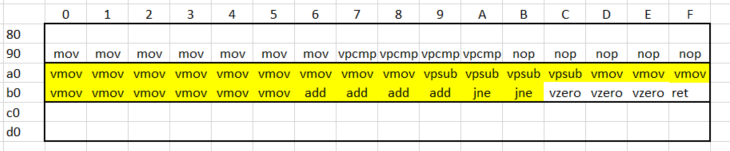
Thick boxes in those tables represent 32B aligned windows and I highlighted with yellow instructions which are hot (the body of the loop).
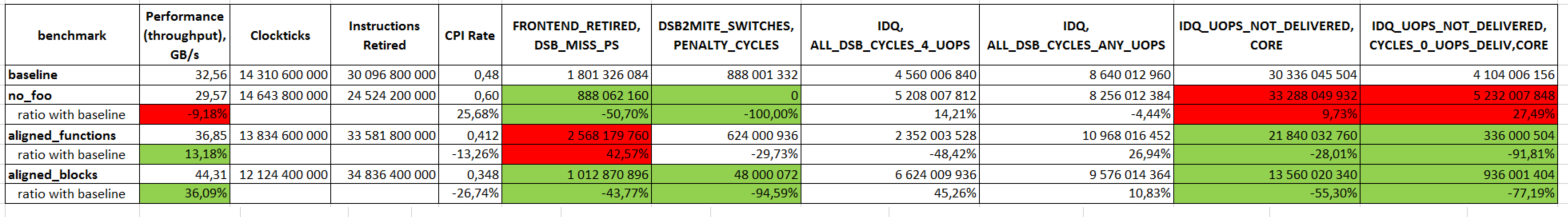
First observation is that second layout is better than the baseline, because all the hot code fits directly into one 32B aligned window. And indeed, second case has twice as less DSB misses (DSB_MISS_PS 1800M vs 888M) and exactly 0 DSB-MITE switches penalty (DSB2MITE_SWITCHES,PENALTY_CYCLES 888M vs 0). But why it performes 10% worse? This is probably some other architectural subtle detail that I don’t know about.
I made several attempts of proving some hypothesis by predicting how decoded instructions will land in DSB, however I’m not 100% sure if I got it right. My take on this can be found DSB layout.pdf.
Profiles and performance counters don’t show any anomaly. But second case is much more front-end bound than the baseline (IDQ_UOPS_NOT_DELIVERED,CYCLES_0_UOPS_DELIV 4100M vs 5200M). I present all the collected counters as well as explanation for them in the end of this post.
To make things even more funny
I did 2 more experiments with explicitly specified alignment: -mllvm -align-all-functions=5 and -mllvm -align-all-blocks=5:
$ ./aligned_functions.sh
---------------------------------------------------------
Benchmark          CPU   Iterations   Throughput   Clockticks/iter
---------------------------------------------------------
func_bench_median  3 ns  218294614    36.8538GB/s  63.37
$ ./aligned_blocks.sh
---------------------------------------------------------
Benchmark          CPU   Iterations   Throughput   Clockticks/iter
---------------------------------------------------------
func_bench_median  3 ns  262104631    44.3106GB/s  46.25
With aligning benchmark_func at the boundary of 32 bytes I had +13% improvement and by aligning all basic blocks (including the beginning of the function) inside benchmark_func at the 32-byte boundary I had +36% improvement. Funny, ain’t it?
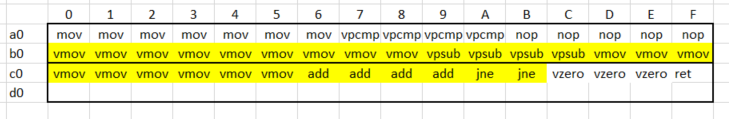
Function placement for the case with aligned beginning of the function doesn’t differ much from the baseline:
 So we have same sort of issues with DSB as we had in the baseline case. Counters show even worse utilization of the DSB:
 DSB_MISS_PS 2600M vs 1800M. However, it is much less front-end bound withIDQ_UOPS_NOT_DELIVERED,CYCLES_0_UOPS_DELIV 330M vs 4100M. In the end what really matters is how good we can supply back-end with the decoded uops.
The case with aligned basic blocks has the following layout:
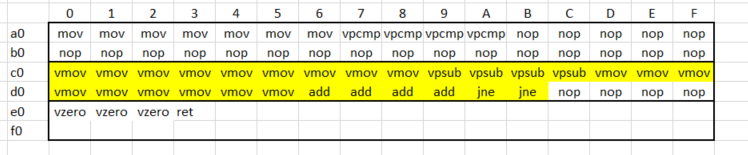 It has good level of DSB utilization as well as the amount of cycles when uops were not delivered to the back-end is very low. See the aggregate table for exact values of the counters.
Again I’m sorry for not having the explanation for those things, but maybe I will have it someday and present it in the next posts.
Collected performance counters
Once again all the code as well as the building scripts are located here. Note, that you need google benchmark library to compile the code.
Description for all the counters for Skylake architecture can be found here:
- FRONTEND_RETIRED.DSB_MISS_PS - Counts retired Instructions that experienced DSB (Decode Stream Buffer) miss.
- DSB2MITE_SWITCHES.PENALTY_CYCLES - Counts Decode Stream Buffer (DSB)-to-MITE switch true penalty cycles. <…> A Decode Stream Buffer (DSB) hit followed by a Decode Stream Buffer (DSB) miss can cost up to six cycles in which no uops are delivered to the IDQ. Most often, such switches from the Decode Stream Buffer (DSB) to the legacy pipeline cost 0–2 cycles.
- IDQ.ALL_DSB_CYCLES_4_UOPS - Counts the number of cycles 4 uops were delivered to Instruction Decode Queue (IDQ) from the Decode Stream Buffer (DSB) path.
- IDQ.ALL_DSB_CYCLES_ANY_UOPS - Counts the number of cycles uops were delivered to Instruction Decode Queue (IDQ) from the Decode Stream Buffer (DSB) path.
- IDQ_UOPS_NOT_DELIVERED.CORE - Counts the number of uops not delivered to Resource Allocation Table (RAT) per thread adding “4 – x” when Resource Allocation Table (RAT) is not stalled and Instruction Decode Queue (IDQ) delivers x uops to Resource Allocation Table (RAT) (where x belongs to {0,1,2,3}).
- IDQ_UOPS_NOT_DELIVERED.CYCLES_0_UOPS_DELIV.CORE - Counts, on the per-thread basis, cycles when no uops are delivered to Resource Allocation Table (RAT). IDQ_Uops_Not_Delivered.core =4.
Caveats
For this particular case alignment issues go away as we increase the number of iterations, say, to 1024. Here is when LSD kicks in. It recognizes that we are in the loop and executing the same sequence of instructions. So it just shuts down the front-end (so we are not fetching instructions anymore) and start executing out of the LSD. So, it’s no more important how our code is aligned.
Another interesting case is that I received -10% drop in performance when using gold linker (-fuse-ld=gold). It’s not that this linker is bad, just the reason is, again, code alignment. I leave this for you if someone will be interested in investigating this.
Why not always align?
Aligning the code means compiler will insert NOPs before the code you want to align. That increases binary size and might cost you performance if you insert a lot of nops in the hot path. In the end executing nops doesn’t come for absolutely free. You need to fetch and decode it.
Conclusions
As you can see, even with such a small amount of code things may get incredibly complicated. I’m not saying we all should be experts in the hardware we are coding for, but at least be informed about such issues. Don’t take the first measured value as a final one. Collect profiles and check that you wasn’t hit by some architectural performance issue.
UPD 23.01.2018:
- Fixed MITE description (thanks to Travis).
- Added clockticks per iteration metric.
- Added my prediction of DSB layout.
UPD 27.01.2018:
- @fernzeit on Reddit shared amazing paper “Producing Wrong Data Without Doing Anything Obviously Wrong!”.
It shows how linking order may affect performance and even how
-O2can be better than-O3. True gem!
All content on Easyperf blog is licensed under a Creative Commons Attribution 4.0 International License