Improving performance by better code locality.
09 Jul 2018
Contents:
- Keep the cold code as far as you can
- Why latter case is better?
- Enough theory, show me the benchmark
- Compiler heuristics
- Built-in expect and attributes for inlining
- PGO (profile-guided optimizations)
Subscribe to my newsletter, support me on Patreon or by PayPal donation.
Data locality is a known problem and there are lots of information written on that topic. Most of modern CPUs have caches, so it’s best to keep the data that we access most frequently in one place (spatial locality). The other side of this problem is not to work on a huge chunk of memory in a given time interval, but work on a small pieces (temporal locality). The most known example of this kind is matrix traversal. And I hope that by now there are no developers who do matrix traversal by columns.
Similar rules apply to the machine code: if we will do frequent long jumps - it won’t be very I-cache efficient. Today I will show one typical example of when it can make a difference.
Without further ado let’s jump to the core of the article.
Keep the cold code as far as you can
Let’s suppose we have a function like that:
void foo(bool criticalFailure, int iter)
{
  if (criticalFailure)
  {
    // error handling code
  }
  else
  {
    // hot code
  }
}
Let’s suppose and error handling function is quite big (several I-cache lines) and it was inlined, which brought the code from it to the body of foo. As we know, the code is always layed out sequentially in memory. If we disassemble our foo function we might see something like this:
; I stripped all the offsets and other not important stuff
<foo>:

cmp rdi, 0
jz .hot

; error handling code
jmp .end

; hot code

.end:
ret
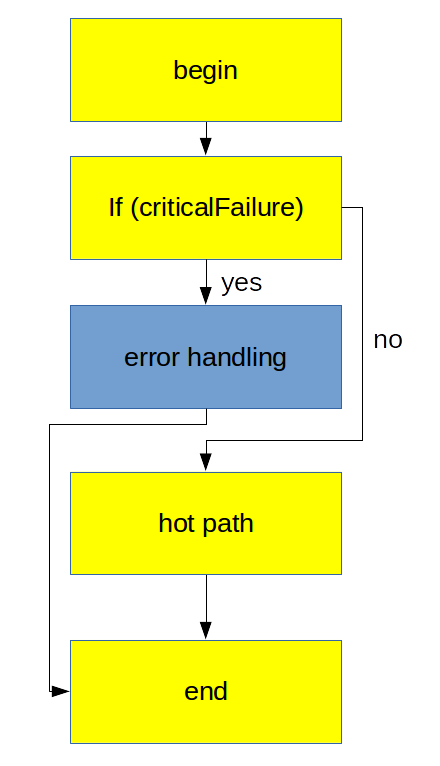
If we vizualize it we will see the picture how our hot code is layed out in memory:

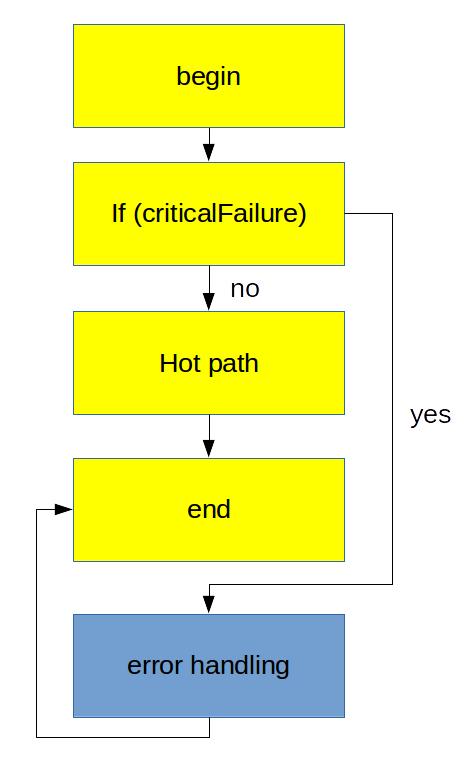
On the picture above I highlithed typical hot path over foo function with yellow and cold path with blue. You can clearly see, that we make one long jump from the block “if (criticalFailure)” to “hot path”. Without justification (for now) let’s take a look at another way of placing the blocks inside the function:

Why latter case is better?
(updated, thanks to comments by Travis)
There are a number of reasons for the second case to perform better:
-
If we would have sequential hot path, it will be better for our I-cache. The code that will be executed will be prefetched before CPU will start executing it. It is not always the case for the original block placement. In the presented example it doesn’t make significant impact.
-
It makes better use of the instruction and uop-cache: with all hot code contiguous, you don’t get cache line fragmentation: all the cache lines in the i-cache are used by hot code. This same is true for the uop-cache since it cached based on the underlying code layout as well.
-
Taken branches are fundamentally more expensive that untaken: recent Intel CPUs can handle 2 untaken branches per cycle, but only 0.5 taken branches per cycle in the general case (there is a special small loop optimization that allows very small loops to have 1 taken branch/cycle). They are also more expensive for the fetch unit: the fetch unit fetches contiguous chunks of 16 bytes, so every taken jump means the bytes after the jump are useless and reduces the maximum effective fetch throughput. Same for the uop cache: cache lines from only one 32B region (64B on Skylake, I think) are accessed per cycle, so jumps reduce the max delivery rate from the uop cache.
So, how we can make the second case happen? Well, there are 2 issues to fix: error handling function was inlined into the body of foo, hot code was not placed in a fall through position.
Enough theory, show me the benchmark
I wrote a small benchmark to demonstrate the thing and show you the numbers. Below you can find two assembly functions that I benchmarked (written in pure assembly). My hot code only consists of NOPs (instead of real assembly instructoins), but it doesn’t affect the measurements. Benchmark is not doing any useful work, just simulates the real workload. But again, it’s enough to show what I wanted to show.
Complete code of the benchmark can be found on my github. Scripts for building and running the benchmark included. Note, that in order to build it you need to build nasm assembler.
// a_jmp (not efficient code placement)		  // a_fall (improved code placement)
foo:                                              foo:

; some hot code (4 I-cache lines)                 ; some hot code (4 I-cache lines)

cmp rdi, 0                                        cmp rdi, 0
jz .hot                                           jnz .cold

; error handling code (4 I-cache lines)           .hot:
                                                  dec rsi
jmp .end                                          jnz .hot

.hot:                                             .end:
dec rsi                                           ret
jnz .hot
                                                  .cold:
.end:                                             call err_handler
                                                  jmp .end
ret
                                                  err_handler:
                                                  ; error handling code (4 I-cache lines)
                                                  ret
And here is how I’m calling them:
extern "C" { void foo(int, int); }

int main()
{
  for (int i = 0; i < 1000000000; i++)
    foo(0, 32);
  return 0;
}
Now let’s run them. My measurements are for Skylake, but I think it holds for most modern architectures. I measured hardware events in several separated runs. Here are the results:
$ perf stat -e <events> -- ./a_jmp
 Performance counter stats for './a_jmp':

      124623459202      r53019c			  # IDQ_UOPS_NOT_DELIVERED.CORE
      105451915136      instructions              # 1,62  insn per cycle
       64987538427      cycles
           1293787      L1-icache-load-misses
        1000146958      branch-misses
           1259211      DSB2MITE_SWITCHES.PENALTY_CYCLES
       38001539159      IDQ.DSB_CYCLES
       68002930233      IDQ.DSB_UOPS

      16,346708137 seconds time elapsed
$ perf stat -e <events> -- ./a_fall
 Performance counter stats for './a_fall':

      109388366740      r53019c			  # IDQ_UOPS_NOT_DELIVERED.CORE
      105443845060      instructions              # 1,92  insn per cycle
       55019003815      cycles
            825560      L1-icache-load-misses
          33546707      branch-misses
            648816      DSB2MITE_SWITCHES.PENALTY_CYCLES
       41742394288      IDQ.DSB_CYCLES
       71971516976      IDQ.DSB_UOPS

      13,821951438 seconds time elapsed
Overall performance improved by ~15%, which is pretty attractive.
UPD:
Travis (in the comments) showed me that it was the edge case for branch misprediction. You can clearly see that in the good case we have 30 times (!) less branch mispredictions.
Additionally, we see that by reordering basic blocks we have 36% less I-cache misses (but it’s impact is miscroscopic), and DSB coverage is 6% better (calculated from IDQ.DSB_UOPS, but not precisly). Overall, “Front-end bound” metric decreased by 12% (calculated from IDQ_UOPS_NOT_DELIVERED.CORE).
Disclaimer: From my experience, this doesn’t usually give impressive boost in performance. I usually see around 1-2%%, so don’t expect miracles from this optimization. See more information in PGO section.
So, we can make two improtant points from this benchmark:
- Don’t inline the cold functions.
- Put hot code in a fall through position.
Compiler heuristics
Compilers also try to make use of this and thus introduced heuristics for better block placement. I’m not sure they are documented anywhere, so the best way is to dig into the source code. Those heuristics try to calculate cost of inlining the function call and probabilities of branch being taken. For example, gcc treats function calls guarded under condition as an error handling code (cold). Both gcc and llvm when they see a check for a pointer against null pointer: if (ptr == nullptr), they decide that pointer unlikely to be null, and put “else” branch as a fall through.
It’s quite frequent that compilers do different inlining decisions for the same code because they have different heuristics and cost models. But in general, I think when compilers can’t decide which branch has bigger probability, they will leave the original order as they appear in the source code. I haven’t thoroughly tested that though. So, I think it’s a good idea to put your hot branch (most frequent) in a fall through position by default.
Built-in expect and attributes for inlining
You can influence compiler decisions by making hints to it. When using clang you can use this attributes:
void bar() __attribute__((noinline)) // won't be inlined
{
  if (__builtin_expect(criticalFailure, 0))
  {
    // error handling code
    // this branch is NOT likely to be taken
  }
  else
  {
    // hot code
    // this branch is likely to be taken
  }
}
Here is documentation for inline attributes and Built-in expect.
With those hints compiler will not make any guesses and will do what you asked for.
Another disclaimer I want to make is that I’m not advocating for inserting those hints for every branch in your source code. It reduces readability of the code. Only put them in the places where it’s proven to improve performance.
PGO (profile-guided optimizations)
If it’s possible to use PGO in your case, it’s the best option you can choose. PGO will help compiler tune the generated code exactly for your workload. The problem here is that some applications do not have single workload or set of workloads, so it makes impossible to tune for the general case. But if you have such a single hot workload, you’ve better compile your code with PGO.
The guide for using PGO in clang is described here. In short, compiler will first instrument your application with the code for profiling. Then you need to run it, it will generate profile information that you will then feed back to the compiler. Compiler will use this profile information to make better code generation decisions, because now it knows which code is hot and which is cold.
I’ve seen real workloads that were improved up to 15%, which is quite attractive. PGO is not only improve code placement, but also improves register allocation, because with PGO compiler can put all the hot variables into registers, etc.
All content on Easyperf blog is licensed under a Creative Commons Attribution 4.0 International License