Thread Count Scaling Part 4. CloverLeaf and CPython
10 May 2024
Subscribe to my newsletter, support me on Patreon, Github, or by PayPal donation.
This blog is an excerpt from the book. More details in the introduction.
- Part 1: Introduction.
- Part 2: Blender and Clang.
- Part 3: Zstandard.
- Part 4: CloverLeaf and CPython (this article).
- Part 5: Summary.
CloverLeaf
CloverLeaf is a hydrodynamics workload. We will not dig deep into the details of the underlying algorithm as it is not relevant to this case study. CloverLeaf uses OpenMP to parallelize the workload. Similar to other HPC workloads, we should expect CloverLeaf to scale well. However, on our platform performance stops growing after using 3 threads. What’s going on?
To determine the root cause of poor scaling, we collected TMA metrics in four data points: running CloverLeaf with one, two, three, and four threads. Once we compared the performance characteristics of these profiles, one thing became clear immediately. CloverLeaf performance is bound by memory bandwidth. The table below shows the relevant metrics from these profiles that highlight increasing memory bandwidth demand when using multiple threads.
| Metric | 1 thread | 2 threads | 3 threads | 4 threads |
|---|---|---|---|---|
| Memory Bound (% of pipeline slots) | 34.6 | 53.7 | 59.0 | 65.4 |
| DRAM Memory Bandwidth (% of cycles) | 71.7 | 83.9 | 87.0 | 91.3 |
| DRAM Mem BW Use (range, GB/s) | 20-22 | 25-28 | 27-30 | 27-30 |
As you can see from those numbers, the pressure on the memory subsystem kept increasing as we added more threads. An increase in the Memory Bound metric indicates that threads increasingly spend more time waiting for data and do less useful work. An increase in the DRAM Memory Bandwidth metric further highlights that performance is hurt due to approaching bandwidth limits. The DRAM Mem BW Use metric indicates the range total of total memory bandwidth utilization while CloverLeaf was running. We captured these numbers by looking at the memory bandwidth utilization chart in VTune’s platform view as shown in Figure 5.
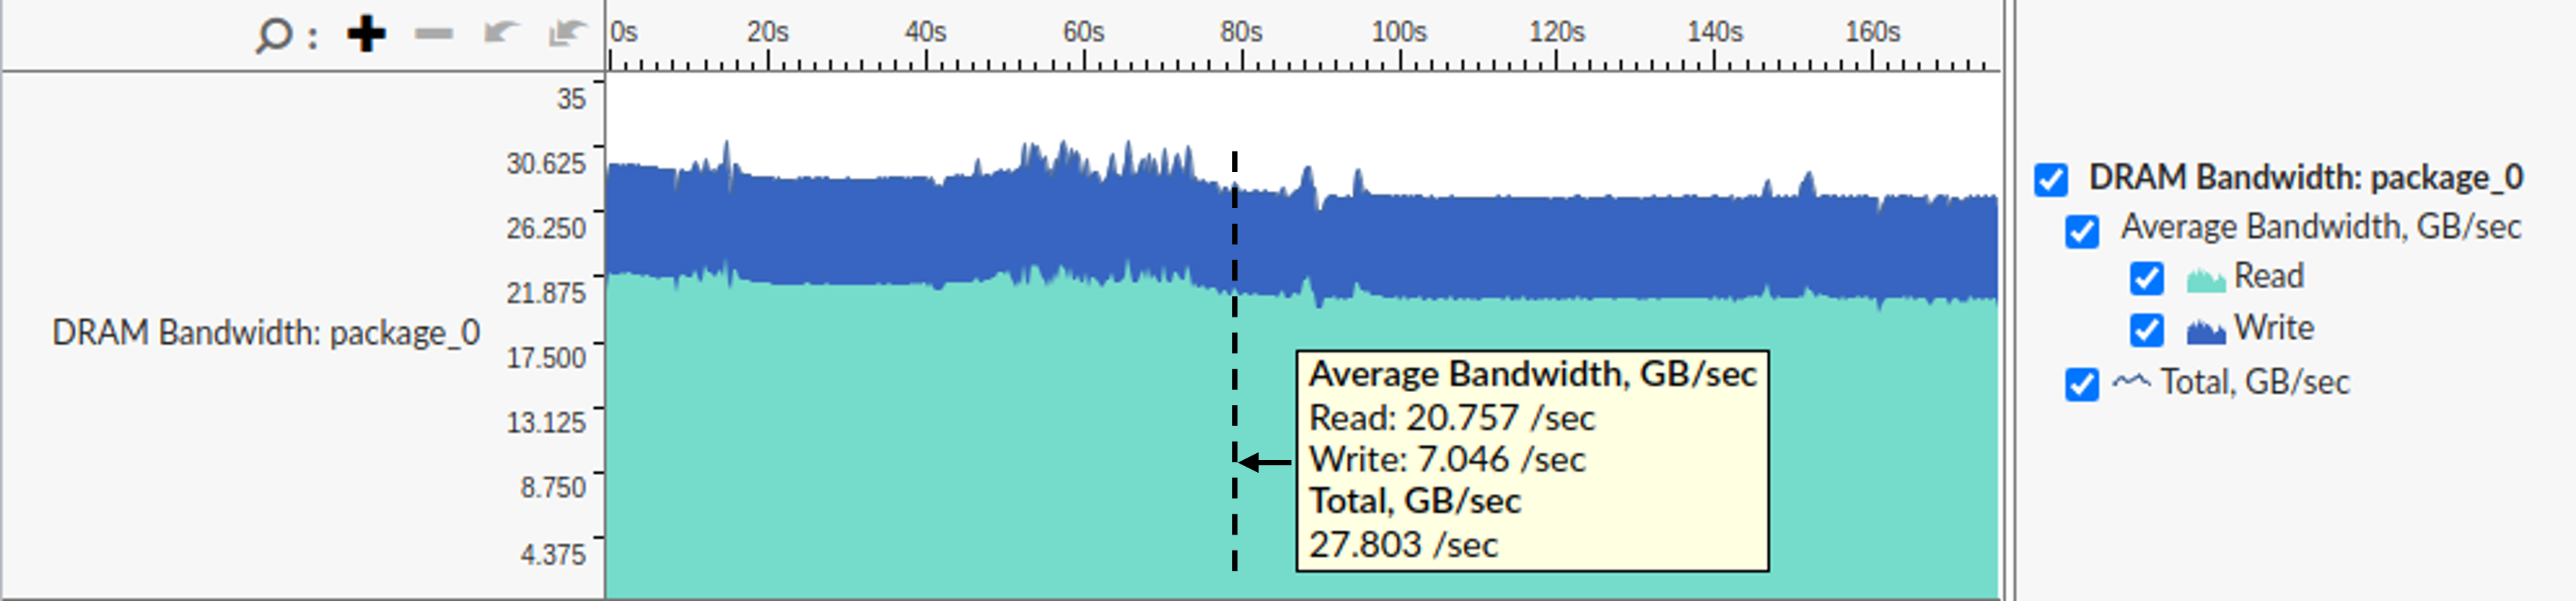 |
|---|
| Figure 5. VTune’s platform view of running CloverLeaf with 3 threads. |
Let’s put those numbers into perspective, the maximum theoretical memory bandwidth of our platform is 38.4 GB/s. However, the maximum memory bandwidth that can be achieved in practice is 35 GB/s.1 With just a single thread, the memory bandwidth utilization reaches 2/3 of the practical limit. CloverLeaf fully saturates the memory bandwidth with three threads. Even when all 16 threads are active, DRAM Mem BW Use doesn’t go above 30 GB/s, which is 86% of the practical limit.
To confirm our hypothesis, we swapped two 8 GB DDR4 2400 MT/s memory modules with two DDR4 modules of the same capacity, but faster speed: 3200 MT/s. This brings the theoretical memory bandwidth of the system to 51.2 GB/s and the practical maximum to 45 GB/s. The resulting performance boost grows with increasing number of threads used, and is in the range from 10% to 33%. When running CloverLeaf with 16 threads, faster memory modules provide the expected 33% performance as a ratio of the memory bandwidth increase (3200 / 2400 = 1.33). But even with a single thread, there is a 10% performance improvement. This means that there are moments when CloverLeaf fully saturates the memory bandwidth with a single thread.
Interestingly, for CloverLeaf, TurboBoost doesn’t provide any performance benefit when all 16 threads are used, i.e., performance is the same regardless of whether you enable Turbo or let the cores run on their base frequency. How is that possible? The answer is: that having 16 active threads is enough to saturate two memory controllers even if CPU cores run at half the frequency. Since most of the time threads are just waiting for data, when you disable Turbo, they simply start to wait “slower”.
CPython
The final benchmark in our case study is CPython. We wrote a simple multithreaded Python script that uses binary search to find numbers (needles) in a sorted list (haystack). Needles are divided equally between worker threads. Unfortunately, the script that we wrote doesn’t scale at all. Can you guess why?
To solve this puzzle, we have built CPython 3.12 from sources with debug information and ran Intel VTune’s Threading Analysis collection while using two threads. Figure 6 visualizes a small portion of the timeline of the Python script execution. As you can see, the CPU time alternates between two threads. They work for 5 ms, then yield to another thread. In fact, if you scroll left or right, you will see that they never run simultaneously.
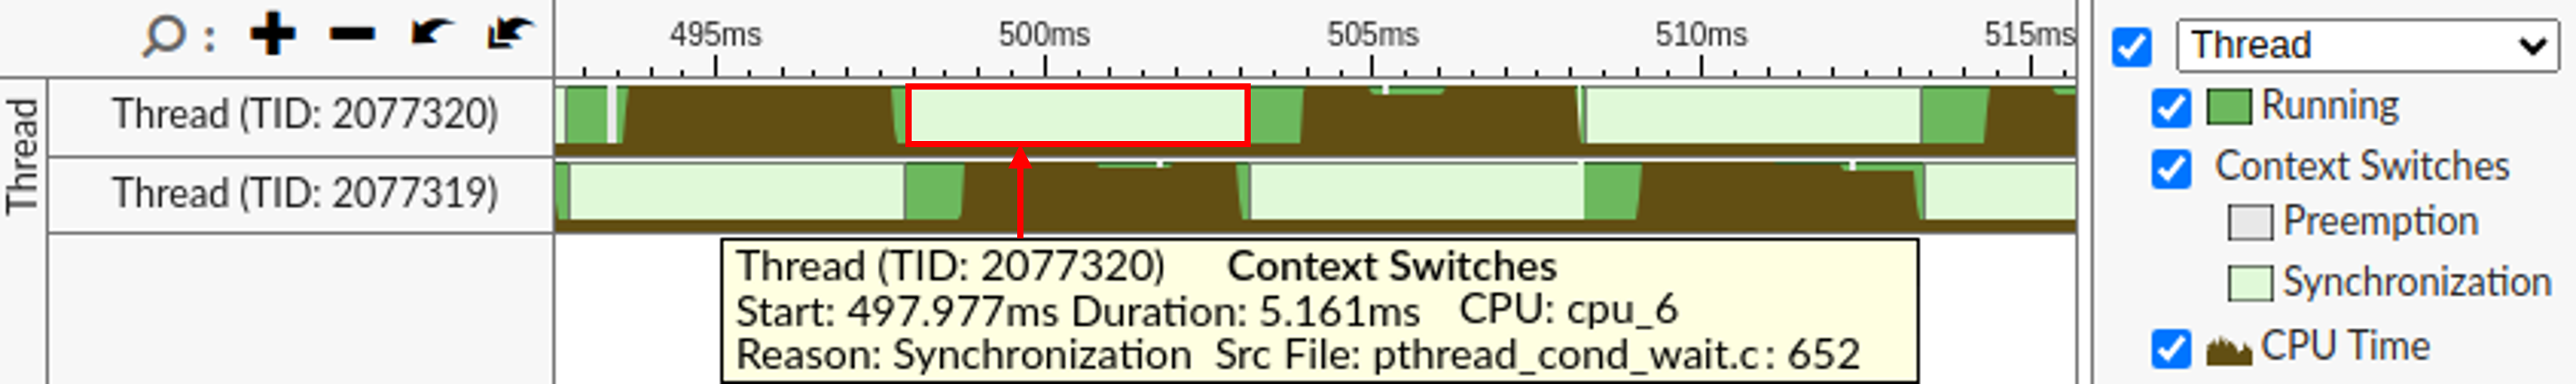 |
|---|
| Figure 6. VTune’s timeline view when running our Python script with 2 worker threads (other threads are filtered out). |
Let’s try to understand why two worker threads take turns instead of running together. Once a thread finishes its turn, the Linux kernel scheduler switches to another thread as highlighted in Figure 6. It also gives the reason for a context switch. If we take a look at pthread_cond_wait.c source code2 at line 652, we would land on the function ___pthread_cond_timedwait64, which waits for a condition variable to be signaled. Many other inactive wait periods wait for the same reason.
On the Bottom-up page (see the left panel of Figure 7), VTune reports that the ___pthread_cond_timedwait64 function is responsible for the majority of Inactive Sync Wait Time. On the right panel, you can see the corresponding call stack. Using this call stack we can tell what is the most frequently used code path that led to the ___pthread_cond_timedwait64 function and subsequent context switch.
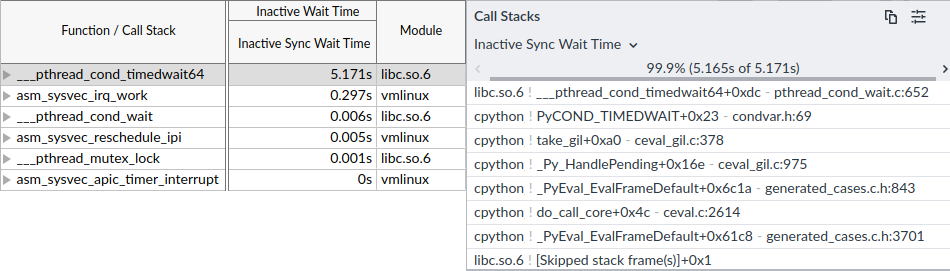 |
|---|
| Figure 7. VTune’s Bottom-Up panel showing code path that contributes to the majority of inactive wait time. |
This takes us to the take_gil function, which is responsible for acquiring the Global Interpreter Lock (GIL). The GIL is preventing our attempts at running worker threads in parallel by allowing only one thread to run at any given time, effectively turning our multithreaded program into a single-threaded one. If you take a look at the implementation of the take_gil function, you will find out that it uses a version of wait on a conditional variable with a timeout of 5 ms. Once the timeout is reached, the waiting thread asks the GIL-holding thread to drop it. Once another thread complies with the request, the waiting thread acquires the GIL and starts running. They keep switching roles until the very end of the execution.
Experienced Python programmers would immediately understand the problem, but in this example, we demonstrated how to find contested locks even without an extensive knowledge of CPython internals. CPython is the default and by far the most widely used Python interpreter. Unfortunately, it comes with GIL, which destroys performance of compute-bound multithreaded Python programs. Nevertheless, there are ways to bypass GIL, for example, by using GIL-immune libraries such as NumPy, writing performance-critical parts of the code as a C extension module, or using alternative runtime environments, such as nogil.3
-> part 5
-
As measured by running micro-benchmarks such as Intel MLC (Memory Latency Checker). ↩
-
Glibc source code - https://sourceware.org/git/?p=glibc.git;a=tree ↩
-
Nogil - https://github.com/colesbury/nogil ↩
All content on Easyperf blog is licensed under a Creative Commons Attribution 4.0 International License