Thread Count Scaling Part 2. Blender and Clang
10 May 2024
Subscribe to my newsletter, support me on Patreon, Github, or by PayPal donation.
This blog is an excerpt from the book. More details in the introduction.
- Part 1: Introduction.
- Part 2: Blender and Clang (this article).
- Part 3: Zstandard.
- Part 4: CloverLeaf and CPython.
- Part 5: Summary.
Blender
Blender is the only benchmark in our suite that continues to scale up to all 16 threads in the system. The reason for this is that the workload is highly parallelizable. The rendering process is divided into small tiles, and each tile can be rendered independently. However, even with this high level of parallelism, the scaling is only 6.1x speedup / 16 threads = 38%. What are the reasons for this suboptimal scaling?
From earlier chapters, we know that Blender’s performance is bounded by floating-point computations. It has a relatively high percentage of SIMD instructions as well. P-cores are much better at handling such instructions than E-cores. This is why we see the slope of the speedup curve decrease after 4 threads as E-cores start getting used. Performance scaling continues at the same pace up until 12 threads, where it starts to degrade again. This is the effect of using SMT sibling threads. Two active sibling SMT threads compete for the limited number of FP/SIMD execution units. To measure SMT scaling, we need to divide performance of two SMT threads (2T1C - two threads one core) by performance of a single P-core (1T1C), also 4T2C/2T2C, 6T3C/3T3C, and so on. For Blender, SMT scaling is around 1.3x in all configurations. Obviously, this is not a perfect scaling, but still, using sibling SMT threads on P-cores provides a performance boost for this workload.
There is another aspect of scaling degradation that we will talk about when discussing Clang’s thread count scaling.
Clang
While Blender uses multithreading to exploit parallelism, concurrency in C++ compilation is usually achieved with multiprocessing. Clang 17 has more than 2'500 translation units, and to compile each of them, a new process is spawned. Similar to Blender, we classify Clang compilation as massively parallel, yet they scale differently. Clang has a large codebase, flat profile, many small functions, and “branchy” code. Its performance is affected by Dcache, Icache, and TLB misses, and branch mispredictions. Clang’s thread count scaling is affected by the same scaling issues as Blender: P-cores are more effective than E-cores, and P-core SMT scaling is about 1.1x. However, there is more. Notice that scaling stops at around 10 threads, and starts to degrade. Let’s understand why that happens.
The problem is related to the frequency throttling. When multiple cores are utilized simultaneously, the processor generates more heat due to the increased workload on each core. To prevent overheating and maintain stability, CPUs often throttle down their clock speeds depending on how many cores are in use. Additionally, boosting all cores to their maximum turbo frequency simultaneously would require significantly more power, which might exceed the power delivery capabilities of the CPU. Our system doesn’t possess an advanced liquid cooling solution and only has a single processor fan. That’s why it cannot sustain high frequencies when many cores are utilized.
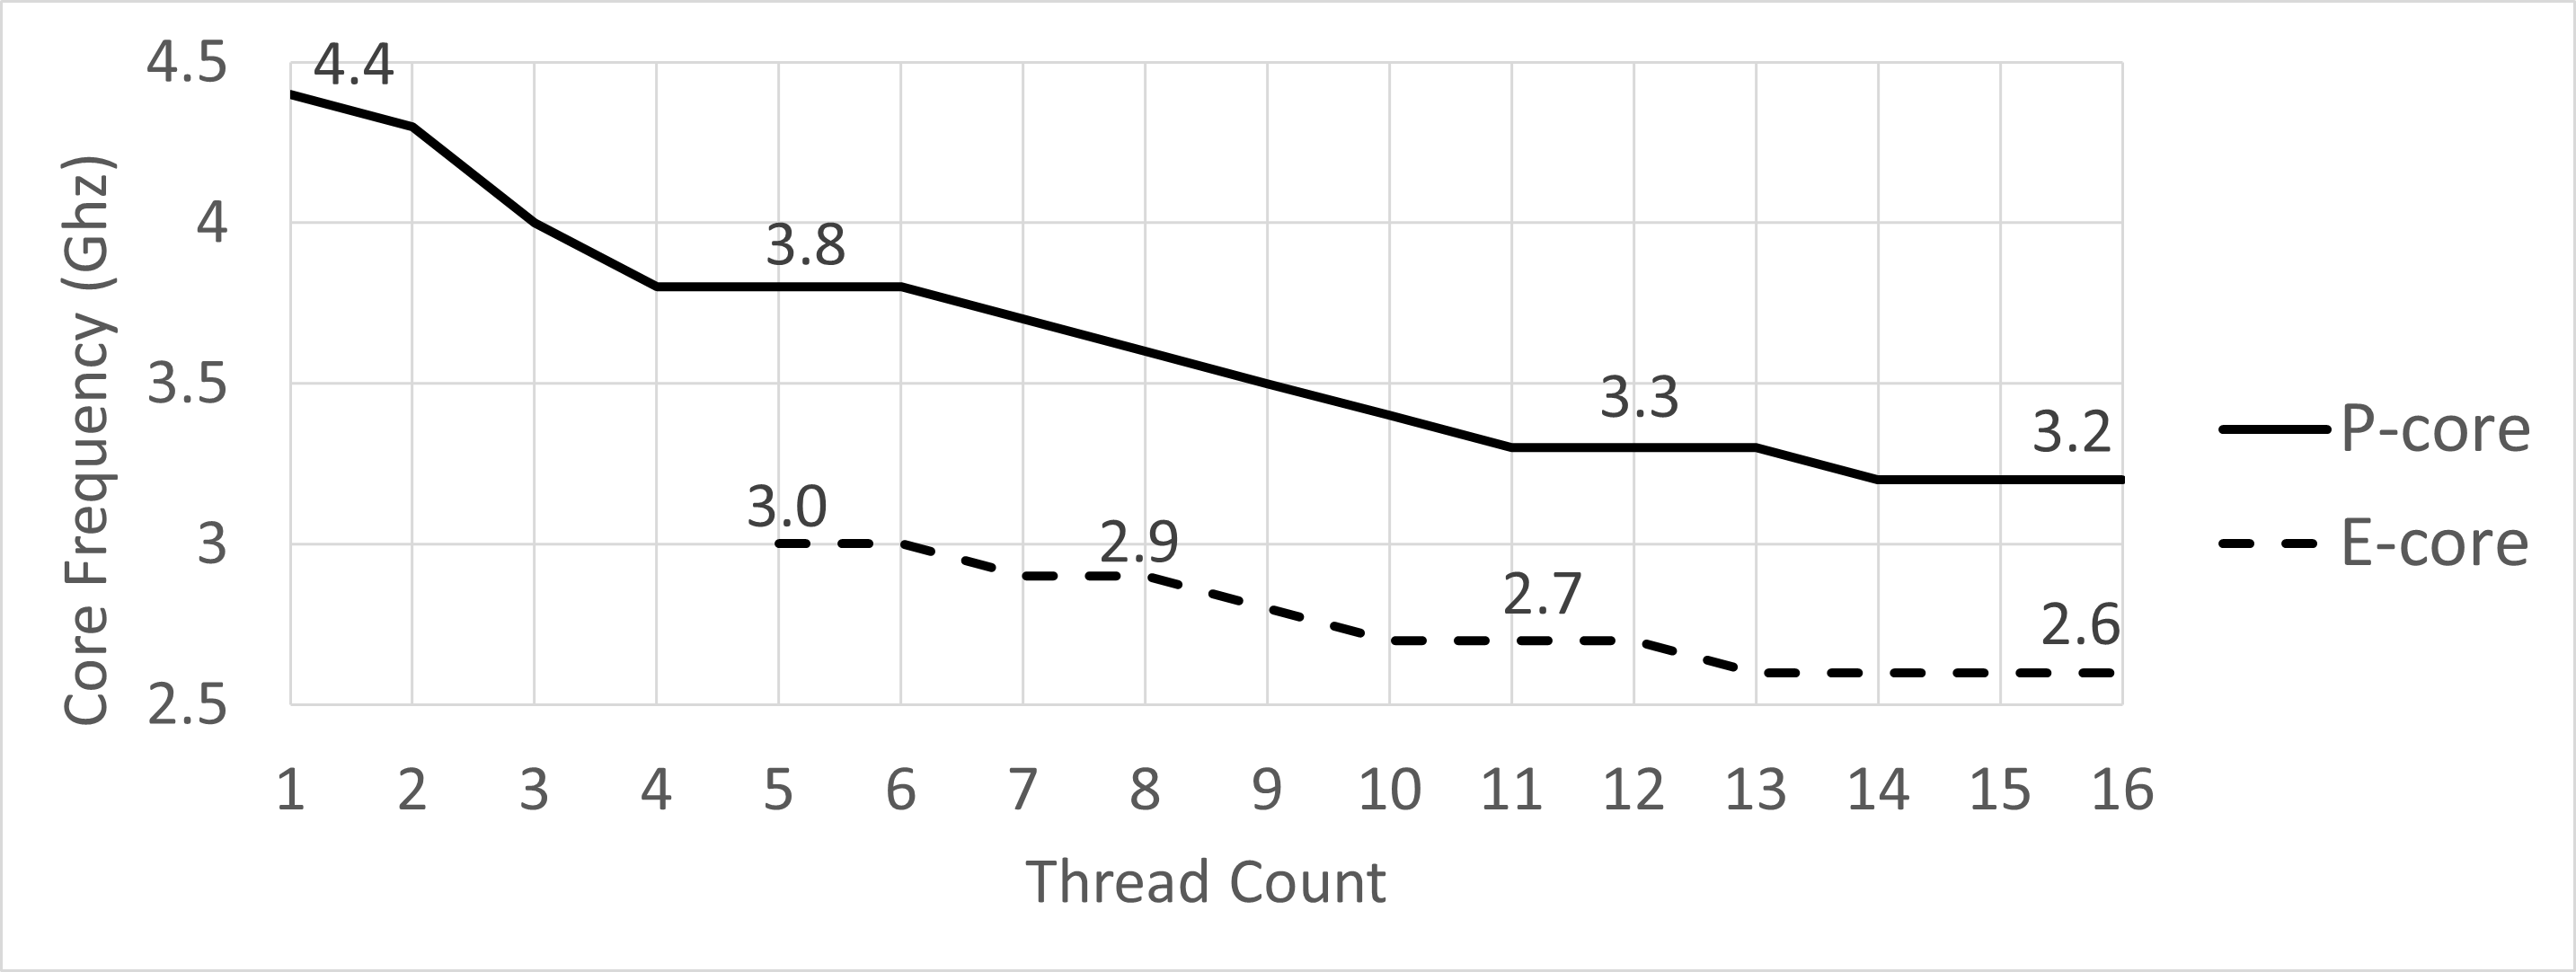
Figure 2 shows the CPU frequency throttling on our platform while running the Clang C++ compilation. Notice that sustained frequency drops starting from a scenario when just two P-cores are used simultaneously. By the time you start using all 16 threads, the frequency of P-cores is throttled down to 3.2GHz, while E-cores operate at 2.6GHz. We used Intel Vtune’s platform view to visualize CPU frequency.
 |
|---|
| Figure 2. Frequency throttling while running Clang compilation on Intel(R) Core(TM) i7-1260P. |
Keep in mind that this frequency chart cannot be automatically applied to all other workloads. Applications that heavily use SIMD instructions typically operate on lower frequencies, so Blender, for example, may see slightly more frequency throttling than Clang. However, it can give you a good intuition about the frequency throttling issues that occur on your platform.
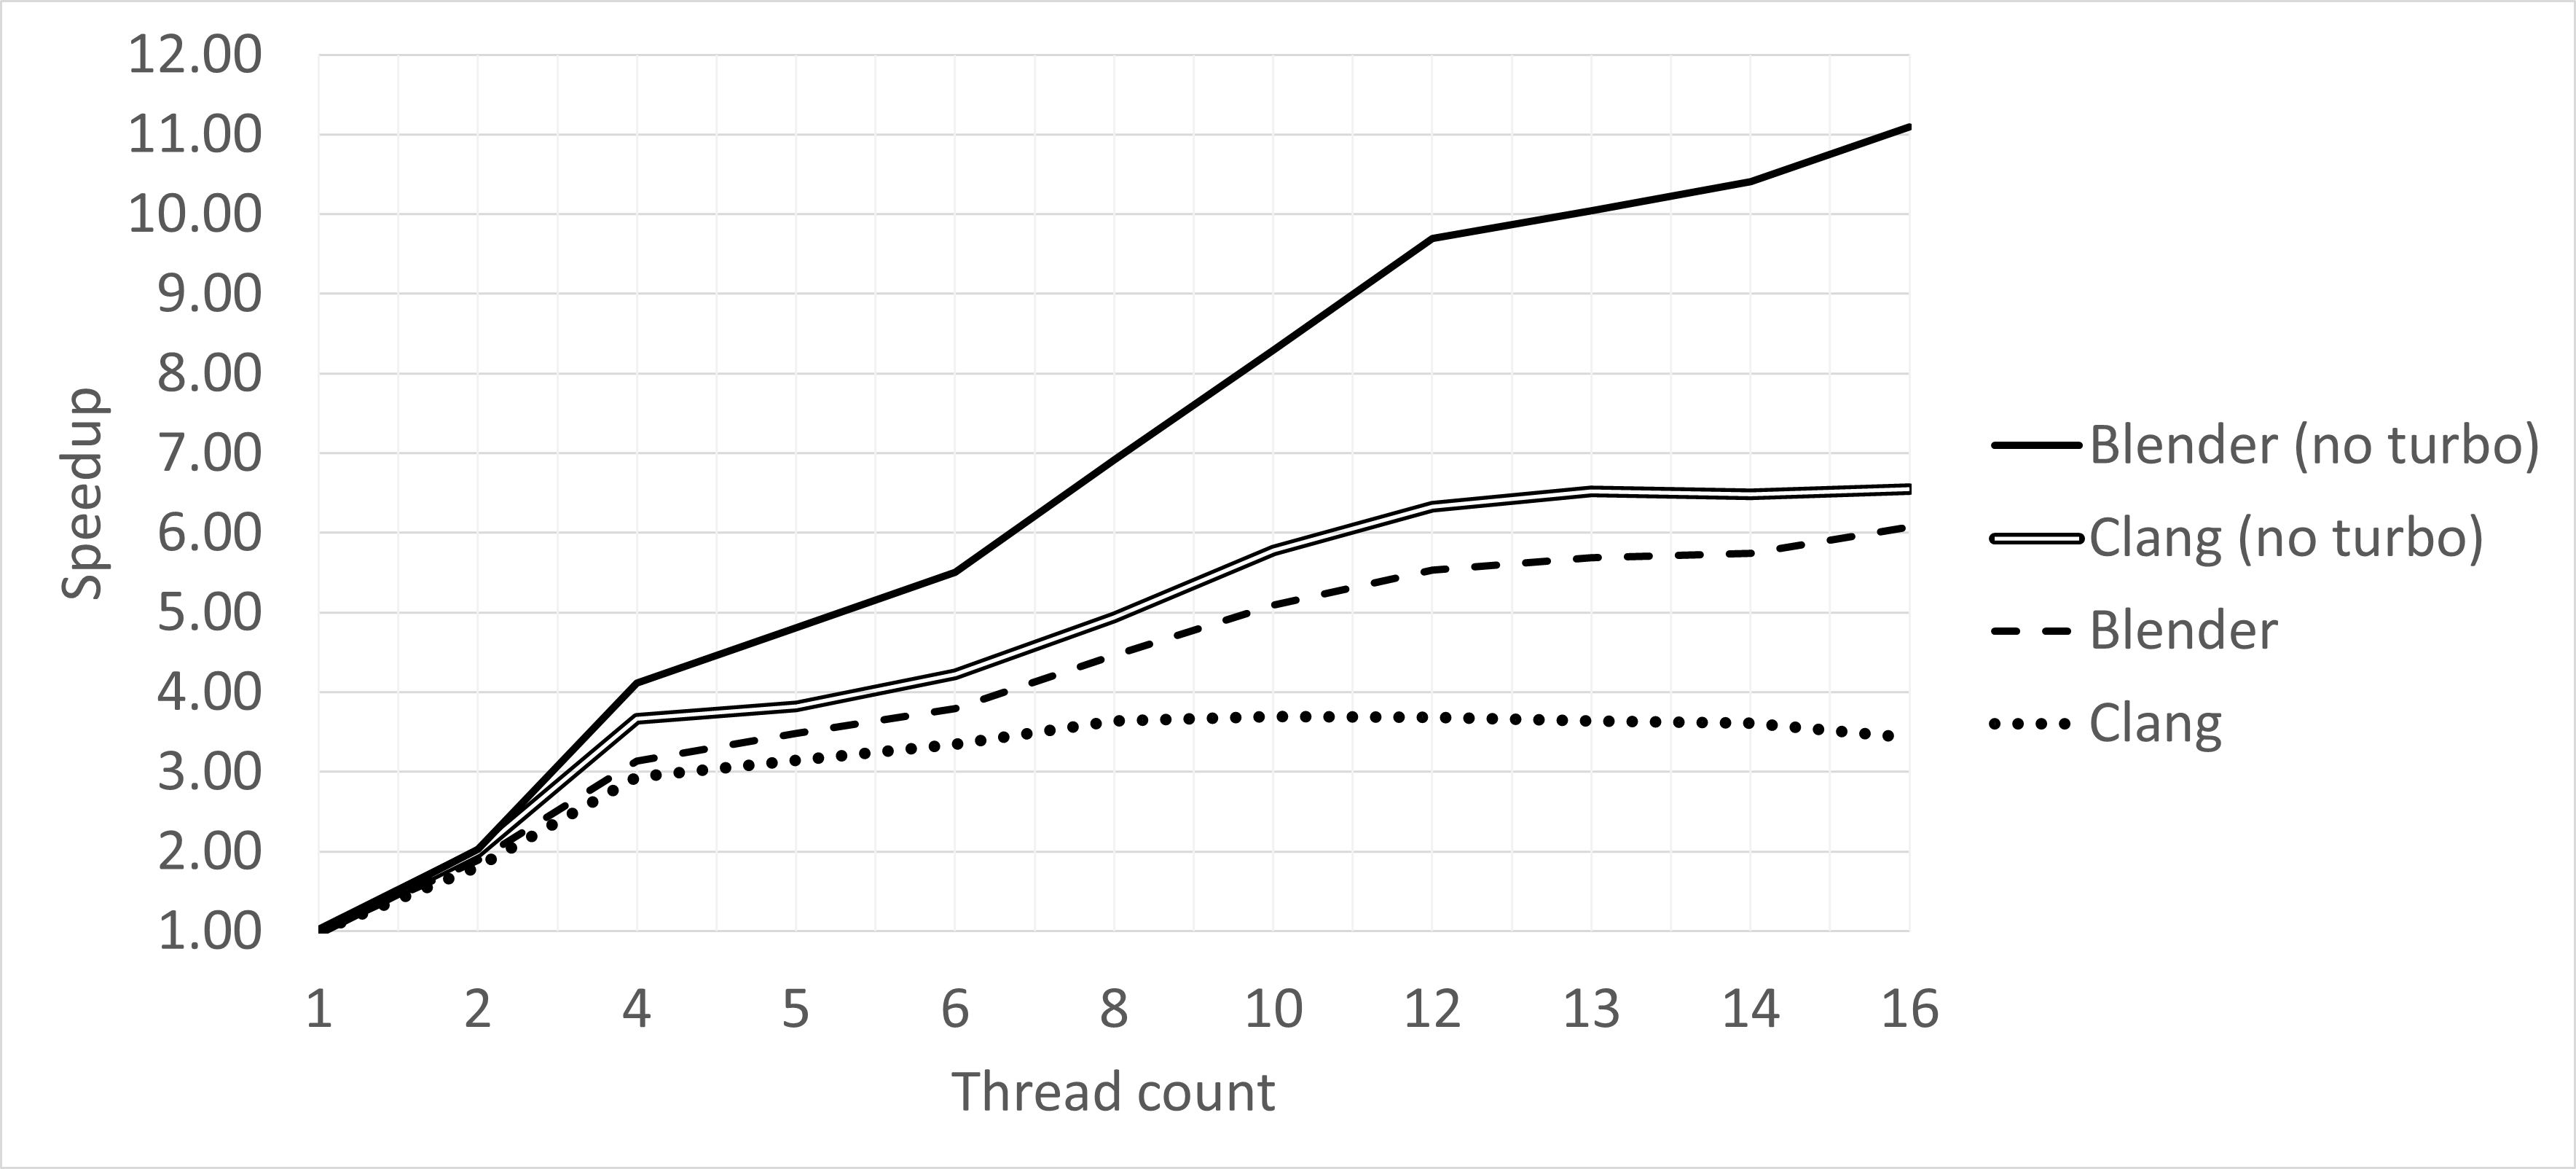
To confirm that frequency throttling is one of the main reasons for performance degradation, we temporarily disabled Turbo Boost on our platform and repeated the scaling study for Blender and Clang. When Turbo Boost is disabled, all cores operate on their base frequencies, which are 2.1 Ghz for P-cores and 1.5 Ghz for E-cores. The results are shown in Figure 3. As you can see, thread count scaling almost doubles when all 16 threads are used and TurboBoost is disabled, for both Blender (38% -> 69%) and Clang (21% -> 41%). It gives us an intuition of what the thread count scaling would look like if frequency throttling had not happened. In fact, frequency throttling accounts for a large portion of unrealized performance scaling in modern systems.
 |
|---|
| Figure 3. Thread Count Scalability chart for Blender and Clang with disabled Turbo Boost. |
Going back to the main chart shown in Figure 1, for the Clang workload, the tipping point of performance scaling is around 10 threads. This is the point where the frequency throttling starts to have a significant impact on performance, and the benefit of adding additional threads is smaller than the penalty of running at a lower frequency.
-> part 3
All content on Easyperf blog is licensed under a Creative Commons Attribution 4.0 International License