Data-Driven tuning. Specialize indirect call.
27 Nov 2019
Contents:
Subscribe to my newsletter, support me on Patreon or by PayPal donation.
This is the second post of the series showing how one can tune the software by introspecting the data on which it operates on and optimize the code accordingly. My intention is just to show one of the many possible ways to speed up execution.
Transformation
Suppose we have a hot dispatch loop:
typedef unsigned (*funPtr)(unsigned N);
funPtr getNextFunPtr(); // returns next pointer to a function

  // dispatch function
  funPtr fp = getNextFunPtr();
  for (...) {
    result += fp(j);
    fp = getNextFunPtr();
  }
Imagine we have many different functions that are being called indirectly through fp. If we know that some hotFun function is called more frequently than the others (say >50% of the time) we might want to specialize the code for the hot function call:
  funPtr fp = getNextFunPtr();
  for (...) {
    if (fp == hotFun)
      result += hotFun(j); // inlinable
    else
      result += fp(j);
    fp = getNextFunPtr();
  }
Important thing to consider: this transformation only makes sense when you know you always have high percentage of hotFun function calls. It’s not easy to define what “high percentage” exactly means. If there would be other workloads where you will have small amount of hotFun function calls, you will pessimize them. Because now you will do one additional check for every loop iteration. Do it only in case you are really sure that your specialized case will get big number of hits. See the chart in the end of the post for more insights.
Timings
On Intel Xeon E5-2643 v4 + Clang 9.0 (sec) with 80% of indirect calls targeting hotFun I have:
original case:    2.87
specialized case: 1.99
That’s a 44% speedup. Not bad! It definitely deserves our attention. Code example and scripts to build the benchmark can be downloaded from my github.
Why it is faster?
In order to make analysis easier, I modified the code presented in the beginning of the article. I generated 10000 random pointers to a function. In the hot loop I iterate over them 100000 times. That makes 109 iterations. While the code is changed the ideas is still the same. See the code on my github for exact implementation.
Let’s look at the hot path for both cases:
original case:
 ┌─>400538:  mov    edi,DWORD PTR [rsp+rbx*1+0x20]  <== load argument
 │  40053c:  call   QWORD PTR [rsp+rbx*2+0x9c60]    <== indirect call
 │  400543:  add    rbx,0x4
 │  400547:  add    ebp,eax                         <== accumulate the result
 │  400549:  cmp    rbx,0x9c40
 └──400550:  jne    400538
specialized case:
 ┌──>400700:  imul   eax,edi,0x93                      <== inlined hotFun
 │┌─>400706:  add    ebp,eax                           <== accumulate the result
 ││  400708:  add    rbx,0x1
 ││  40070c:  cmp    rbx,0x2710
 ││  400713:  je     4006e0
 ││  400715:  mov    rax,QWORD PTR [rsp+rbx*8+0x9c58]  <== load function pointer
 ││  40071d:  mov    edi,DWORD PTR [rsp+rbx*4+0x18]    <== load argument
 ││  400721:  cmp    rax,r15
 └───400724:  je     400700
  │  400726:  call   rax                               <== indirect call
  └──400728:  jmp    400706
Please don’t be confused with the weird loop structure in the latter assembly snippet. The blocks inside the loop are rotated. Compilers are usually doing this in order to create more fall through opportunities. This deserves a dedicated post by itself. I hope one day I will have the time to write it.
Notice, in the second case compiler inlined the function call to hotFun(j). This is what really makes the difference in performance.
Performance details
In original case we execute 8 instructions per iteration: (6 instructions that shown above + 2 instructions inside each function called indirectly: imul + ret).
In specialized case we execute 9 instructions for the hot path and 12 instructions for the slow path. Here is the breakdown. Hot path executes instructions sequentially from 400700 to 400724 (9 instructions). Cold path executes instructions from 400706 to 400728 (10 instructions) + 2 instructions inside each function called indirectly: imul + ret. Given hot path executes 80% of the time, we have 9 * 0.8 + 12 * 0.2 = 9.6 instructions per iteration on average.
We can confirm it by looking at the stats (my benchmark has 109 iterations):
original case (8 instructions per iteration):
 10580290629  cycles         #    3,677 GHz
  8067576938  instructions   #    0,76  insn per cycle
  3005772086  branches       # 1044,472 M/sec
   239298395  branch-misses  #    7,96% of all branches
specialized case (9.6 instructions per iteration):
  7395272630  cycles         #    3,677 GHz
  9601102790  instructions   #    1,30  insn per cycle
  2545283844  branches       # 1265,616 M/sec
   245757806  branch-misses  #    9,66% of all branches
But the question you may have is: “why we execute more instructions but run faster?” I did some in-depth investigation and found that in the default case call+ret instructions get into the critical path while in the specialized case critical path is way smaller. Feel free to skip this part if you don’t need that level of details.
First of all, I really encourage you to read a blog post “A whirlwind introduction to dataflow graphs” by Fabian Giesen to understand what do I mean by critical path.
I used the method described in the post “Precise timing of machine code with Linux perf” to find out that in original case ideal1 iteration executes in 6 cycles. I think that in the original case critical path comprises of call, add rbx,0x4, cmp+jne. Indirect call involves loading function pointer from the memory which should take 4 cycles assuming the value is in the L1-cache. Later add and cmp+jne introduce dependency chain, thus execute in 1 cycle each. That makes a total of 6 cycles.
Specialized case is a little bit trickier. I found that hot path executes 2.8 cycles per iteration (!) on average2. Every cold iteration is typically mispredicted and executes 27 cycles per iteration on average2. Again, we can confirm our hypothesis by doing some math: 2.8 cyc * 80% + 27 cyc * 20% = 7.6 cycles on average per iteration. Not that far from 7.4 cycles measured by perf stat (see above). What’s more important, I found that 65% of the hot iterations execute in just 2 cycles (ideal1 iteration). This means that the critical path comprises of only add rbx,0x1 and cmp+je. Again, please read the post about dataflow graphs if you have doubts why, for example, imul isn’t on the critical path of execution.
If someone is interested in exact details of how I measured it, shoot me an email.
Important thing to consider: In my code example every function that gets called through fp is just one line of code (multiply by some prime number). Given that, this is the extreme case where this transformation shines the most. Improvement will certainly drop with the amount of code you add to every “foo” function. In my tests I stopped seeing performance gains after adding more than 15 multiplications in each called function (see charts below)3. Again, see code on my github if you want to see exact implementation of the benchmark.
Related thoughts
I played with the benchmark in two different dimensions: percentage of hotFun function calls and amount of code inside each of the functions called indirectly through fp. Results are in the charts below.
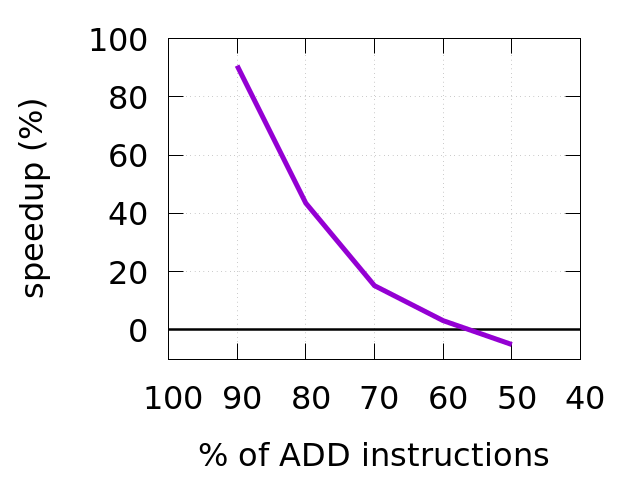
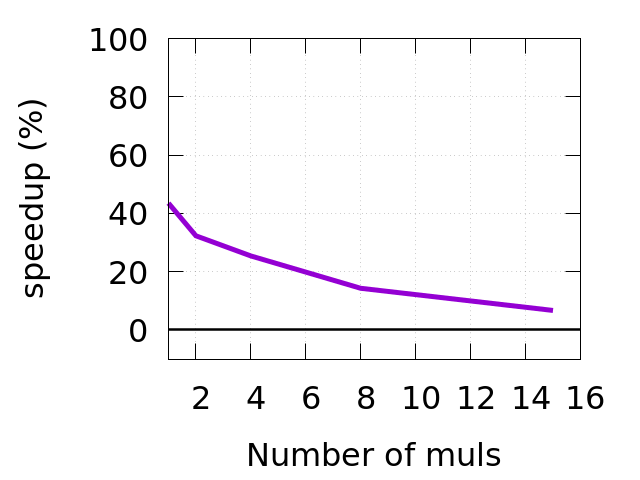
You can see that speedup ends after we go below 60% of hotFun function calls in the workload (left chart). Also, speedup will be decreasing with the amount of code we add in each function we call indirectly through fp. You can see it on the right chart.
This is definitely the case for compilers with PGO. However, even with PGO compilers may decide not to specialize the indirect call due to their integrated cost model, so it’s always good to check the result.
How to know which function gets what amount of hits? You can manually instrument the code by inserting printf statements and parse the output. That’s a naive approach. More sophisticated method of getting this data that requires no source code changes is described here.
It turns out that it is not so easy to do for C++ virtual calls, that are essentially the same indirect calls. Since every member function has implicit this argument, language rules do not allow comparing pointers to member functions or casting them to void (see this article for details). This transformation is often called “devirtualization”.
And of course, do not apply any transformation blindly, always measure first.
-
I used the method described in the post “Precise timing of machine code with Linux perf”. ↩ ↩2
-
I suspect that the more code I added in hot function, the more inlined code found its way into the hot loop in
main. This introduces FrontEnd bottlenecks which are orthogonal to this article. ↩
All content on Easyperf blog is licensed under a Creative Commons Attribution 4.0 International License