Data-Driven tuning. Specialize switch with one hot case.
22 Nov 2019
Subscribe to my newsletter, support me on Patreon or by PayPal donation.
This is the first post of the series showing how one can tune the software by introspecting the data on which it operates on and optimize the code accordingly. My intention is just to show one of the many possible ways to speed up execution.
Suppose we have a hot switch inside the loop like that:
  for(;;) {
    switch(instruction) {
      // handle different instructions
    }
  }
If you know that one instruction executes much more frequently than the others (say 90% of the time) you might want to specialize the code with the most frequent case without entering the switch statement:
  for(;;) {
    if (instruction == ADD) {
      // handle ADD
    } else {
      switch(instruction) {
        // handle other instructions
      }
    }
  }
UPD: user Giuseppe Ottaviano @ot_y on twitter mentioned that the same result can be achieved by using __builtin_expect which is more readable than hand-written version (godbolt.org/z/QDeGJX):
  for(;;) {
    switch(__builtin_expect(instruction, ADD)) {
      // handle different instructions
    }
  }
Important thing to consider: this transformation only makes sense when you know you always have big percentage of ADD instructions handled. If there would be other workloads where you will have small amount of such instructions, you will pessimize them. Because now you will do one additional check for every loop iteration. Do it only in case you are really sure that your specialized case will get big number of hits.
Also check if compiler with PGO will do this transformation for you. Compilers have integrated cost models to choose where this would be profitable based on profile summary. They may decide not to specialize the switch like I showed.
Why it is faster? Let’s look at the hot path for both cases:
original case:
8.93  : ┌┬─>4008b0: add    rdi,0x1                       <== go to next symbol
0.52  : ││  4008b4: cmp    BYTE PTR [rdi-0x1],0x10       <== go to default case?
6.54  : │└──4008b8: ja     4008b0
3.99  : │   4008ba: movzx  eax,BYTE PTR [rdi-0x1]        <== indirect jump through
9.27  : │┌──4008be: jmp    QWORD PTR [rax*8+0x401320]        the index in the table
     ...││
29.52 : │   400970: addsd  xmm0,QWORD PTR [rip+0xb90]    <== our hot case
14.38 : └───400978: jmp    4008b0
specialized case:
0.05  : ┌──>400a20: add    rdi,0x1                       <== go to next symbol
0.03  : │   400a24: movzx  eax,BYTE PTR [rdi]
4.83  : │   400a27: cmp    al,0x4                        <== go to hot case?
0.00  : │┌──400a29: je     400a50
    ... ││
17.05 : │└─>400a50: addsd  xmm0,QWORD PTR [rip+0xab0]    <== our hot case
33.73 : └───400a58: jmp    400a20
Important thing to consider: Here the extreme case is shown, where this transformation shines the most. Improvement will certainly drop with the amount of code you add to process each instruction.
Code example and scripts to build the benchmark can be downloaded from my github.
Timings on Intel Xeon E5-2643 v4 + gcc 4.8.5 (sec):
original case:    2.06
specialized case: 1.62
Easy to see, in original case we execute 3 branches per iteration and only 2 in specialized case. This also can be confirmed by looking at the stats.
original case:
 7609558798  cycles         #    3,677 GHz
 7024246955  instructions   #    0,92  insn per cycle
 3004688046  branches       # 1451,950 M/sec
  152842733  branch-misses  #    5,09% of all branches
specialized case:
 5988420359  cycles         #    3,674 GHz
 6300888185  instructions   #    1,05  insn per cycle
 2185973475  branches       # 1341,303 M/sec
  183306832  branch-misses  #    8,39% of all branches
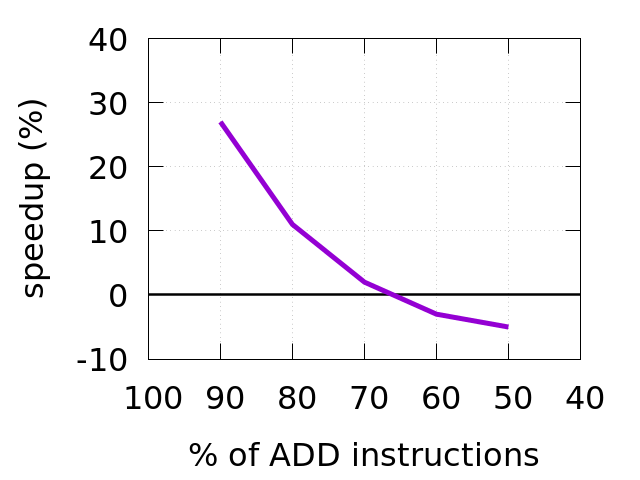
I played with the benchmark and tried different amount of ADD instructions in the workload. Results are in the chart below.

You can see that speedup ends after we go below 70% of ADD instructions in the workload.
How to know which case gets what amount of hits? You can manually instrument the code by inserting printf statements and parse the output. That’s a naive approach. More sophisticated method of getting this data that requires no source code changes is described here.
See computed goto blog post for more ideas how hot switch can be improved.
And of course, do not apply any transformation blindly, always measure first.
All content on Easyperf blog is licensed under a Creative Commons Attribution 4.0 International License