Performance Benefits of Using Huge Pages for Code.
01 Sep 2022

Contents:
- Recap on Memory Pages
- Huge Pages for data AND code
- Example: speedup Clang compilation
- Closing thoughts
Subscribe to my newsletter, support me on Patreon or by PayPal donation.
Many people know about performance benefits of using Huge Pages for data, but not many of them know that Huge Pages can be used for code as well. In this article, I show how to speed up source code compilation for the clang compiler by 5% if you allocate its code section on Huge Pages. If it seems small to you to justify the effort, I can say that all major cloud service providers care about every 1% they could optimize since it translates into immense cost savings. And hey, why leave performance on the table?
But before we jump into the topic, I feel that I need to give a brief recap for readers to refresh their knowledge about Memory Pages. Feel free to skip this introduction if you are familiar with all of this or just skim through it if it’s too boring for you. I’ll try to make it brief, I promise.
Recap on Memory Pages
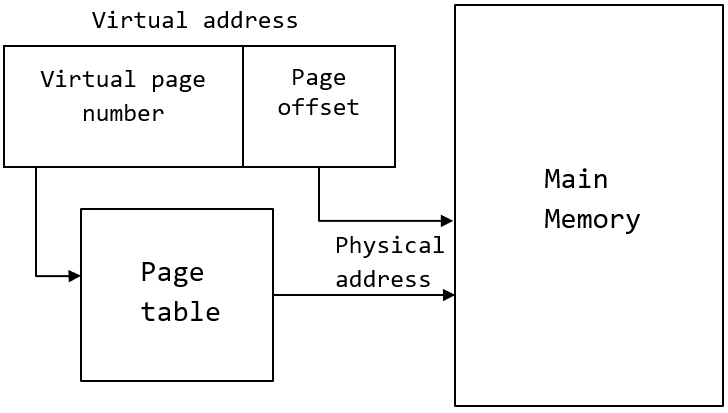
Virtual Addresses. Applications operate on virtual addresses, which serve 2 purposes: 1) protection and 2) effective physical memory management. Memory is split into pages, the default page size on x86 is 4KB, and on ARM it’s 16KB. So, every address can be split into the address of the page + the offset on that page. In the case of a 4KB page, this will be 52 rightmost bits for page address and 12 leftmost bits for offset within that page. You only need to translate the page address (first 52 bits) since the page offset doesn’t change.
Translations. Since user-space applications don’t know the physical addresses, HW needs to translate virtual to physical addresses to access the data in memory. The kernel maintains a page table, which holds address mappings from virtual pages into physical pages. Without HW support for such translations, every time you need to do a load or store, you would 1) interrupt the process, 2) kernel handles that interrupt, and 3) interrupt service routine “walks” the page table and retrieves the translation. At that point, we are looking at 10000+ cycles, which would be unbearable, of course.
TLBs. The good thing is that changes to that table are relatively not frequent, so it’s a good idea to cache some of the most frequent ones in HW. Such a cache exists in probably every modern CPU and is called TLB (Translation Lookaside Buffer), which keeps the most recent translations. There is a hierarchy of L1 ITLB (Instructions), L1 DTLB (Data), followed by L2 STLB (Shared - instructions and data). On modern laptop processors, L1 can hold up to a few hundred recent translations1, and L2 can hold a few thousand. Now, with the default page size on x86 of 4KB, every such entry in the TLB is a mapping for a 4KB page. Given that, L1 TLB can cover up to 1MB of memory, and L2 cover up to 10 MB.
Page Walks. 10MB of memory space covered by L2 STLB sounds like should be enough for many applications, right? But consider what happens when you miss in TLB. Ok, you don’t have to interrupt the process, that would be terrible for performance. You see, it’s such an important issue, that HW gets your back covered in this case again. The thing is that the format of the page table is dictated by the HW, to which OS’es have to comply. Because HW knows the format of the page table, it can search for translations by itself, without waking up the kernel. This mechanism is called “HW page walker”, which, in the event of TLB cache miss, will do the entire page table traversal internally. I.e. it will issue all the necessary instructions to find the required address translation. It is much faster, but still, a page walk is very expensive.
Huge Pages for data AND code
As I said in the introduction paragraph, people typically use large pages for data. Any algorithm that does random accesses into a large memory region will likely suffer from TLB misses. Examples are plenty: binary search in a big array, large hash tables, histogram-like algorithms, etc. The reason is simple: because the size of a page is relatively small (4KB), there is a high chance that the page you will access next is not in the TLB cache.
How do you solve it? Using Huge Pages, of course, what else you would expect? On x86, besides the default 4KB pages, you also have an option of allocating 2MB and 1GB pages. Let me do the math for you: with just one 2MB page you can cover the same amount of memory as with 512 default 4KB pages. And guess what, you need fewer translation entries in the TLB caches. It does not eliminate TLB misses completely, but greatly increases the chance of a TLB hit. I know you’re probably interested in how to start using Huge Pages, but I do not want to repeat others. And especially since there are so many good articles out there. This and that are among my favorites. You can find an example in one of our recent Performance Tuning Challenges (Youtube) (Slides - slide 19).
If you’re still with me, today I wanted to talk about using Large Pages for mapping the code section of your application onto Huge Pages. I see many people talk about Huge Pages for use with malloc, mmap, and so on. But the same problem exists not just for data but for instructions as well. And yet it doesn’t get much attention. Let’s fix that!
Example: speedup Clang compilation
The example I use for demonstration purposes is a well-known Clang compiler which has a very flat performance profile, i.e. there are no clear hotspots in it. Instead, many functions take 1-2% of the total execution time. The complete section of statically built clang binary on Linux has a code section of ~60MB, which does not fit into L2 STLB. What likely happens in this case, is that multiple hot functions are scattered all around that 60MB memory space, and very rarely do they share the same memory page of 4KB. When they begin frequently calling each other, they start competing for translation entries in the ITLB. Since the space in L2 STLB is limited, this may become a serious bottleneck, as I will show next.
Baseline
To show the benefits of using Huge Pages for the code section, I have built the latest Clang compiler from sources using instructions from here. I limited it only to building the compiler itself for the x86 target:
$ cmake -G Ninja -DCMAKE_BUILD_TYPE=Release -DLLVM_ENABLE_PROJECTS="clang" -DLLVM_TARGETS_TO_BUILD=X86 ../llvm
To demonstrate the performance problem, I compiled one of the LLVM sources with my newly built compiler and collect ITLB misses:
$ perf stat -e iTLB-loads,iTLB-load-misses ../llvm-project/build/bin/clang++ -c -O3 <other options> ../llvm-project/llvm/lib/Transforms/Vectorize/LoopVectorize.cpp
  180,759,568      iTLB-loads
   12,068,728      iTLB-load-misses          #    6.68% of all iTLB cache accesses

 15.416281961 seconds time elapsed
Also, there is a nice little script built on top of Linux perf to estimate the fraction of cycles the CPU was stalled due to instruction TLB misses. It can give you an intuition of how much potential speedup you can achieve by tackling this issue.
$ git clone https://github.com/intel/iodlr.git
$ export PATH=`pwd`/iodlr/tools/:$PATH
$ measure-perf-metric.sh -m itlb_stalls -e ../llvm-project/build/bin/clang++ -c -O3 <other options> ../llvm-project/llvm/lib/Transforms/Vectorize/LoopVectorize.cpp
=================================================
Final itlb_stalls metric
--------------------------------------------------
FORMULA: metric_ITLB_Misses(%) = 100*(a/b)
         where, a=icache_64b.iftag_stall
                b=cycles
=================================================
metric_ITLB_Misses(%)=7.0113070100
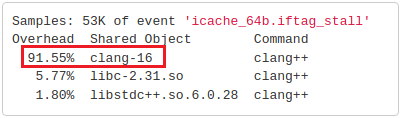
The previous output tells us that 7% of cycles that Clang spent compiling LoopVectorize.cpp was wasted doing demanding page walks and populating TLB entries. 7% is a significant number, so there is something to improve. You can also continue the analysis by adding the -r option to measure-perf-metric.sh. This will sample on icache_64b.iftag_stall event to locate the place where the TLB stalls are coming from. Now let’s consider what we can do about that ITLB misses.
Option1: align code section at 2MB boundary
Our first option is to tell the loader/kernel to place the code section of an application onto preallocated (explicit) Huge Pages. The key requirement here is that the code section must be aligned at the Huge Page boundary, in this case, 2MB. As you may have guessed, it requires that you relink your binary.
Here is the full command line to rebuild the clang compiler with the code section aligned at the 2MB boundary, notice I only added two -z linker options:
$ cmake -G Ninja -DCMAKE_BUILD_TYPE=Release -DLLVM_ENABLE_PROJECTS="clang" -DLLVM_TARGETS_TO_BUILD=X86 ../llvm -DCMAKE_CXX_LINK_FLAGS="-Wl,-zcommon-page-size=2097152 -Wl,-zmax-page-size=2097152"
$ ninja -j `nproc` clang
Now that I’ve done that I can see the difference in the generated ELF binary:
Baseline:
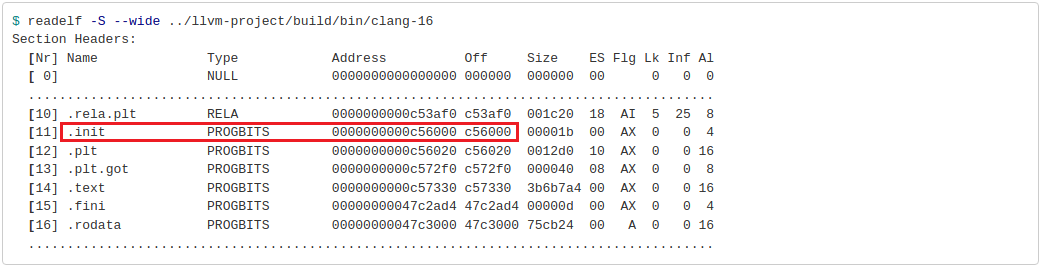
Aligned at 2MB boundary:
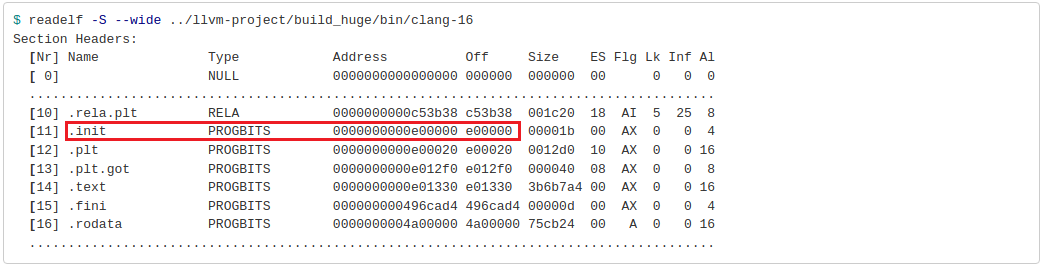
In the modified case, the PROGBITS section starts from the offset 0xe00000, which equals 14MB, so it is a multiple of 2MB. While in the baseline case, the .init section starts right after the .rela.plt section with not so many padding bytes added. Notice that the size of the .text section didn’t change – it’s the same functional code, just the offset has changed.
The obvious downside is that the binary size gets larger. In my case, the size of the clang-16 executable increased from 111MB to 114MB. Since the problem with ITLB misses usually arises for large applications, an additional 2-4MB of padded bytes might not make a huge difference, but something to keep in mind.
Configuring the target machine
Now that we’ve relinked our binary, we need to reconfigure the machine which will use our “improved” clang compiler. Here are the steps that you should do:
$ sudo apt install libhugetlbfs-bin
$ sudo hugeadm --create-global-mounts
$ sudo hugeadm --pool-pages-min 2M:128
Notice, I use libhugetlbfs, which is unfortunately no longer actively maintained. The good thing is that most of the things you can do manually, e.g. the sudo hugeadm --pool-pages-min 2M:128 command likely does echo 128 | sudo tee /proc/sys/vm/nr_hugepages under the hood. The same goes for --create-global-mounts command. Check out this Linux kernel documentation page for more details.
“Why 128 huge pages?” you would ask. Well, the size of the code section of the clang executable is 0x3b6b7a4 (see above), which is roughly 60MB. I could have allocated less, I agree, but since I have 16GB of RAM on my system… Once I reserved 128 explicit huge pages memory usage jumped from 0.9Gb to 1.15G. That space became unavailable for other applications not utilizing huge pages. You can also check the effect of allocating explicit huge pages if you run:
$ watch -n1 "cat /proc/meminfo  | grep huge -i"
AnonHugePages:      2048 kB
ShmemHugePages:        0 kB
FileHugePages:         0 kB
HugePages_Total:     128    <== 128 huge pages allocated
HugePages_Free:      128
HugePages_Rsvd:        0
HugePages_Surp:        0
Hugepagesize:       2048 kB
Hugetlb:          262144 kB <== 256MB of space occupied
Running the relinked binary
OK, so we allocated huge pages, let’s run the binary:
$ hugectl --text ../llvm-project/build_huge/bin/clang++ -c -O3 <other options> ../llvm-project/llvm/lib/Transforms/Vectorize/LoopVectorize.cpp
Notice, that I prepended my command with hugectl --text, which according to the description, “requests remapping of the program text”. I do not claim that I fully understand all the mechanics associated with it. Again, I would be happy if someone helps explain all the interactions between the binary, loader, and kernel.
The need to use hugectl can be eliminated if we set the special bit in the ELF header. Such a bit determines if the text segment is backed by default with huge pages. The same bit for the data segment exists as well. Here is how you can flip that switch:
$ hugeedit --text ../llvm-project/build_huge/bin/clang-16
Segment 2 0x0 - 0xc55758 () default is BASE pages
Segment 3 0xe00000 - 0x496cae1 (TEXT) default is HUGE pages   <==
Segment 4 0x4a00000 - 0x59502b0 () default is BASE pages
Segment 5 0x5c04960 - 0x6095ef8 (DATA) default is BASE pages
Now I can run ../llvm-project/build_huge/bin/clang-16 without controlling it at runtime with hugectl --text. This step can also be done at the time of building the compiler.
I know you were waiting to see the results. Here we go…
$ perf stat -e iTLB-loads,iTLB-load-misses ../llvm-project/build_huge/bin/clang++ -c -O3 <other options> ../llvm-project/llvm/lib/Transforms/Vectorize/LoopVectorize.cpp
   46,838,084      iTLB-loads
    1,627,038      iTLB-load-misses          #    3.47% of all iTLB cache accesses

 14.701666694 seconds time elapsed
Comparing to the baseline, we have 7 times less iTLB misses (12M -> 1.6M), which resulted in a 5% faster compiler time (15.4s -> 14.7s). You can see that we didn’t fully get rid of iTLB misses, as there are still 1.6M of those, which account for 4.1% of all cycles stalled (down from 7% in the baseline).
A good indicator that the code of your application was backed by Huge Pages is to watch /proc/meminfo. In my case, I observed 30 huge pages used by the process, which is enough to back the entire code section of the clang compiler.
# while clang compilation is running...
$ watch -n1 "cat /proc/meminfo  | grep huge -i"
HugePages_Total:     128
HugePages_Free:       98 <== 30 huge pages are in use
Option2: remap the code section at runtime
I recently discovered another way of doing the same thing but without the need to recompile your application. Sounds interesting? I was very surprised when I experimented with it.
There is an iodlr library, which can automatically remap the code from the default pages onto huge pages. The easiest way to use it is to build the liblppreload.so library and preload it when running your application. For example:
$ cd iodlr/large_page-c
$ make -f Makefile.preload
$ sudo cp liblppreload.so /usr/lib64/
$ LD_PRELOAD=/usr/lib64/liblppreload.so ../llvm-project/build/bin/clang++ -c -O3 <other options> ../llvm-project/llvm/lib/Transforms/Vectorize/LoopVectorize.cpp
This gives the results indistinguishable from the previous method: roughly the same number of iTLB misses and the same running time. Pretty cool! The good thing about it is that you can speed up existing applications even when you don’t have access to the source code. I haven’t measured the overhead of remapping2, but I tend to think it’s not big. I haven’t dug too deep into the liblppreload.so implementation, but if you’re interested, you can take a look at the code, it’s not that big.
The liblppreload.so library works both with explicit (EHP) and transparent huge pages (THP). By default it will use THP, so they must be enabled (/sys/kernel/mm/transparent_hugepage/enabled should be always or madvise). You can check that THP are being used by again, watching the /proc/meminfo:
# while clang compilation is running...
$ watch -n1 "cat /proc/meminfo  | grep huge -i"
AnonHugePages:     61440 kB     <== 30 transparent huge pages are in use
HugePages_Total:     128
HugePages_Free:      128        <== explicit huge pages are not used
If you want to use EHP instead, then you need to prepend the command line with IODLR_USE_EXPLICIT_HP=1:
$ IODLR_USE_EXPLICIT_HP=1 LD_PRELOAD=/usr/lib64/liblppreload.so clang++ <...>
Regardless of whether you use explicit or transparent Huge Pages, this method doesn’t require you to recompile the application. This is especially useful when you don’t have access to the source code.
Finally, if you want to get rid of the need for users of your application to preload the liblppreload.so, you can also integrate it into the code of your application to automatically remap the code section right at the startup of your application (full example):
#include "large_page.h"

int main() {
  map_status status;
  bool is_enabled;
  status = IsLargePagesEnabled(&is_enabled);
  if (status == map_ok && is_enabled) {
    status = MapStaticCodeToLargePages();
    if (status == map_ok) {
      // code section remapped
    }
  }
  // ...
}
Benchmarks
For peace of mind, I did some benchmarking of both options (aligning the code at 2MB and the iodlr library) against the baseline. As a benchmark, I build three different clang compilers and used them to build clang from sources (aka self-build). I measured the total time it takes to compile the entire codebase as well as measuring iTLB misses. Here is my benchmarking command line3:
$ perf stat -e iTLB-loads,iTLB-load-misses -- ninja -j `nproc` clang
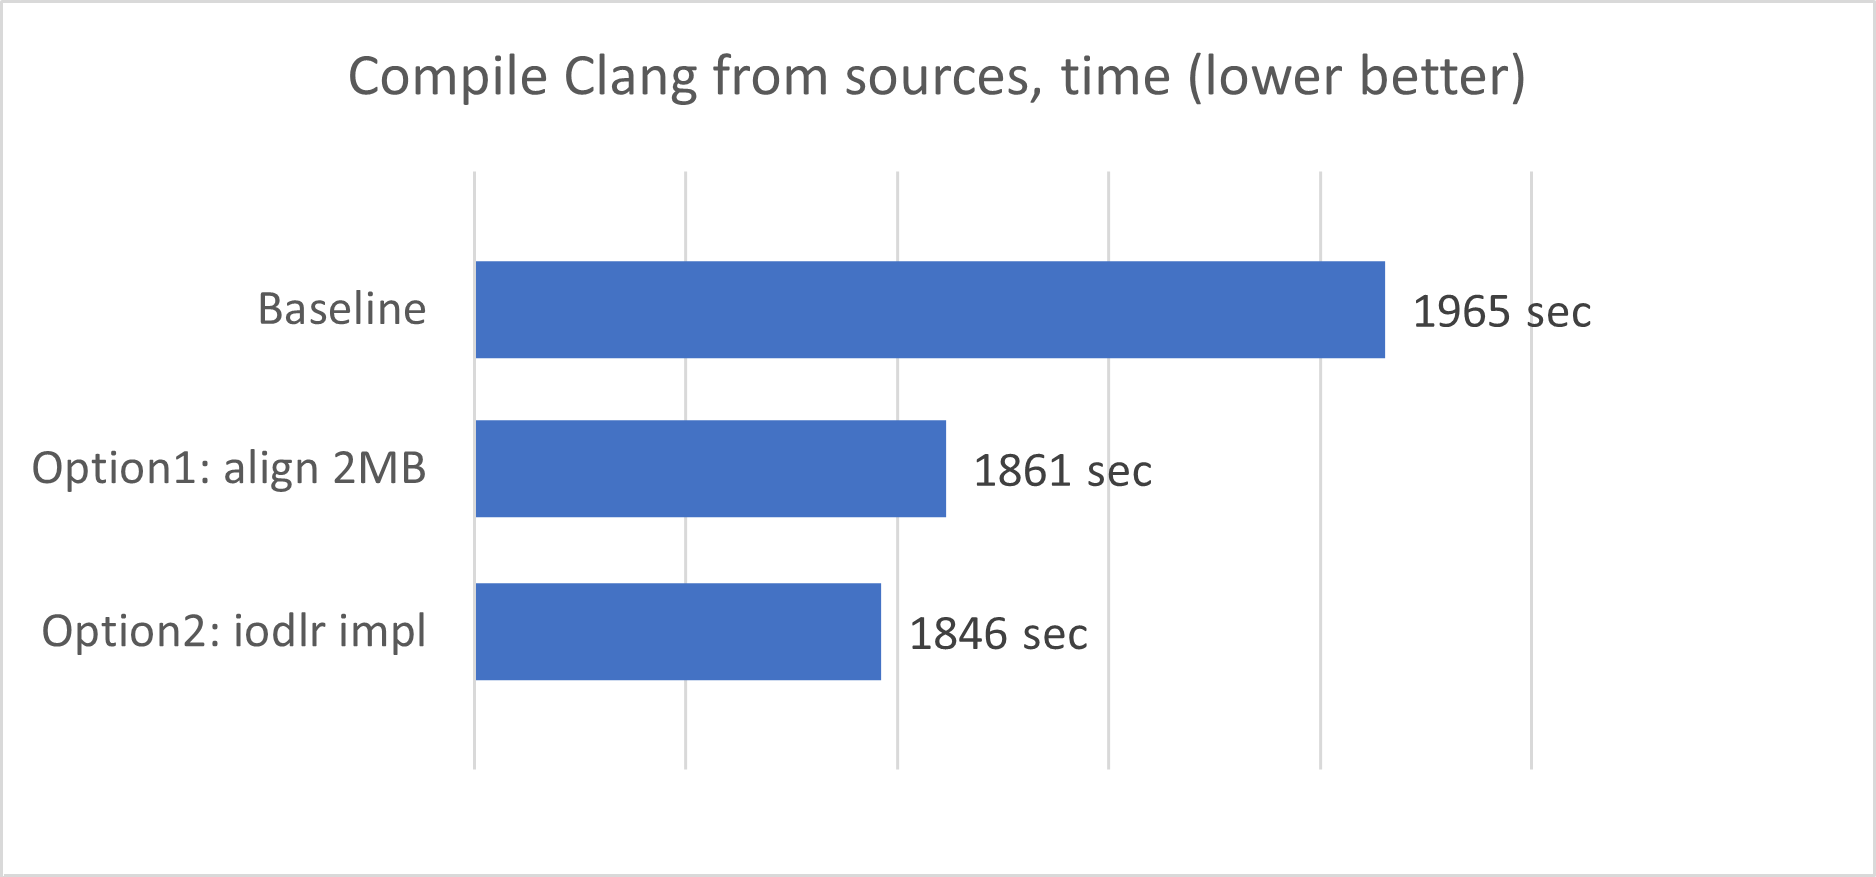
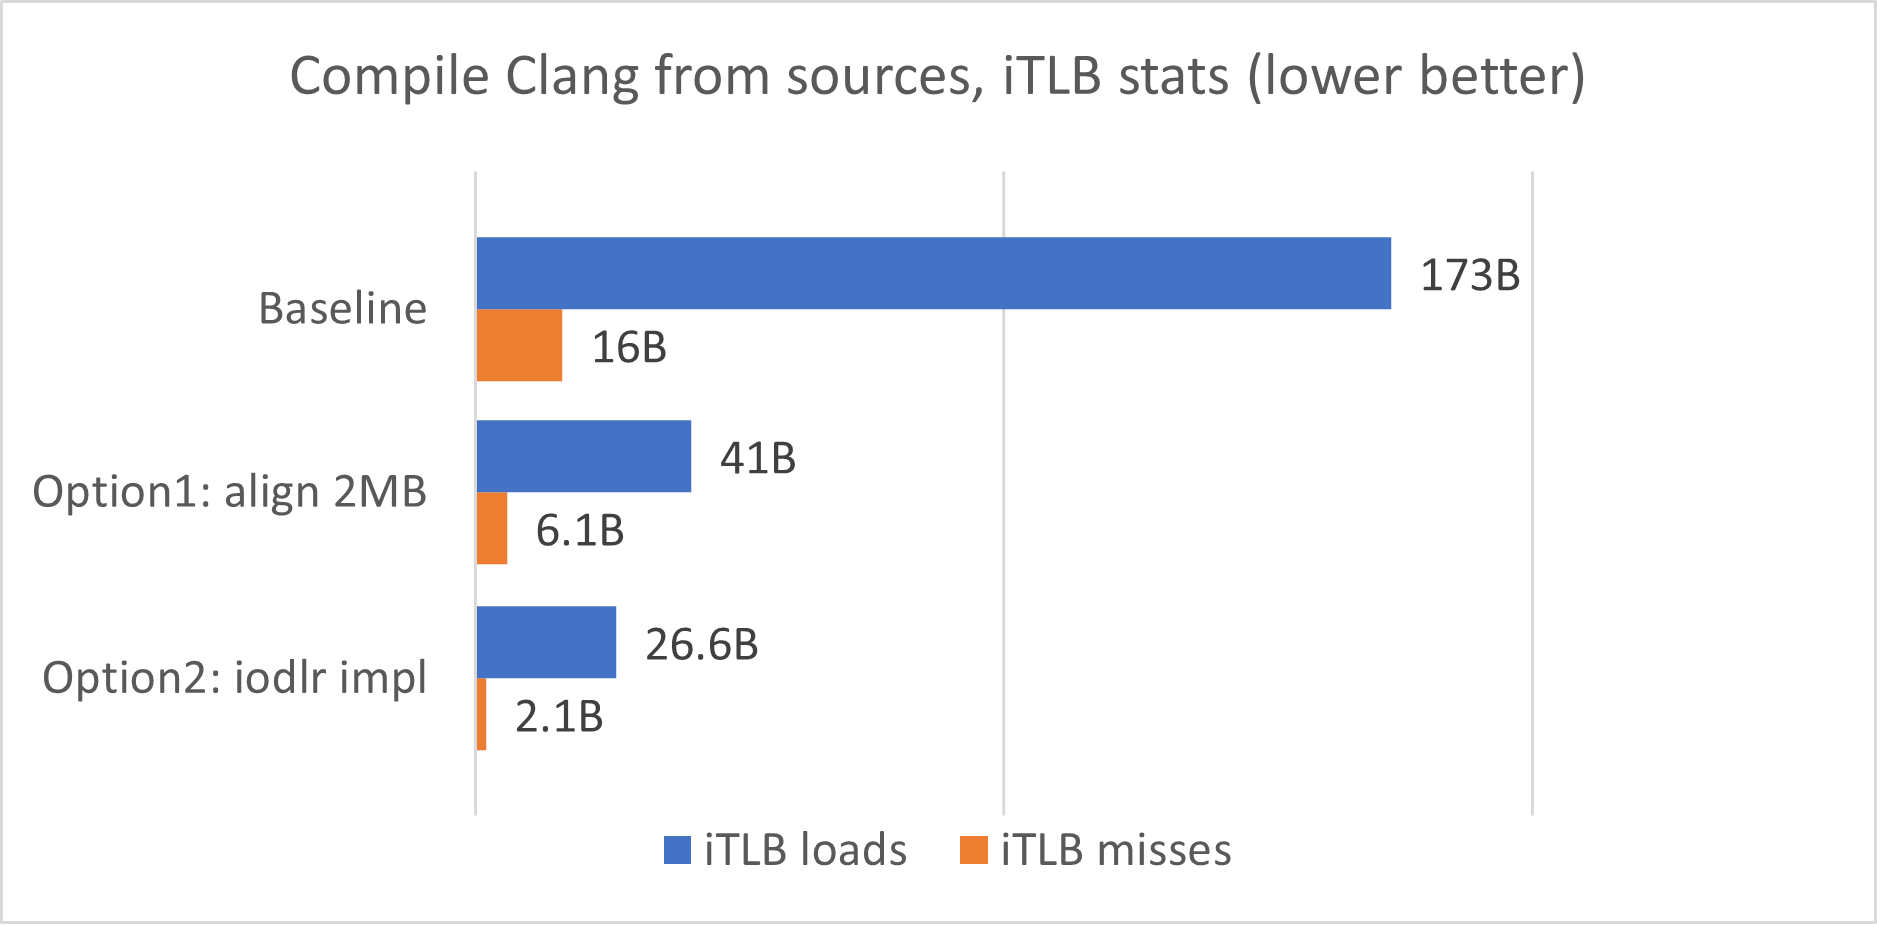
So yeah, as you can see, using Huge pages gives roughly 5% faster compile times for the recent Clang compiler. Option 2 (iodlr version) is faster than option 1, and I should say that I don’t have a good explanation to that, it could be just a measurement error.
Closing thoughts
Hey, sorry for the long article, but there was a lot to cover. I hope that it sparked your interest in using Huge Pages for code especially if you’re maintaining a large codebase. For further reading, I would recommend the paper “Runtime Performance Optimization Blueprint: Intel® Architecture Optimization with Large Code Pages”, which was instrumental to me.
Speaking of downsides, I should point out that remapping .text onto Huge Pages is not free and takes additional execution time. This may hurt rather than help short-running programs. Remember the mantra? Always Measure. Another consideration is about Transparent Huge Pages, which suffer from non-deterministic allocation latency and memory fragmentation. The reason is that to satisfy a Huge Page allocation request at runtime, the Linux kernel needs to find a contiguous chunk of 2MB. If unable to find, it needs to reorganize the pages, resulting in significantly longer allocation latency. In contrast, Explicit Huge Pages are allocated in advance and are not prone to such problems.
BTW, another way to attack iTLB misses is to BOLT your application. Among all other things, it will likely group all the hot functions, which should also drastically reduce the iTLB bottleneck. However, I think Huge Pages is a more fundamental solution to the problem since it doesn’t adapt to the particular behavior of the program. As a double proof, you can try using Huge Pages after bolting your application to see if there are any gains to be made.
I did all the experiments on Linux, but what about Windows4 or Mac? The answer is I don’t know if the same is possible and I haven’t tried. I was able to find a few articles about using it for data but not for code. I would appreciate it if someone could provide more insights.
Last words before you close the huge page of this article… If you’ve been reading it and thinking that the default 4KB is unreasonably small page size in the year 2022, hey, let’s not open a whole can of worms. Let me just refer you to this article by one of the industry experts where he explores the topic in more detail.
Footnotes:
-
This is just to give you intuition, not to provide exact numbers – you can google them relatively easily. One thing I need to mention is that usually L1 ITLB and L1 DTLB have a different number of entries. For example, the latest Intel Golden Cove core has 256 entries in ITLB and 96 entries in DTLB. ↩
-
I’m not sure it’s visible when running with
LD_DEBUG=statistics. Let me know in the comments if you know how to measure the overhead. ↩ -
Ideally I would like to run it at least 3 times, but man… on my machine compilation of the entire clang codebase takes about an hour, so, maybe next time. ↩
-
To utilize huge pages on Windows, one needs to enable
SeLockMemoryPrivilegesecurity policy and useVirtualAllocAPI. ↩
All content on Easyperf blog is licensed under a Creative Commons Attribution 4.0 International License