Understanding CPU port contention.
21 Mar 2018
Contents:
- Utilizing full capacity of the load instructions
- Performance counters that I use
- Results
- Why we have 8 cycles per iteration?
- Some explanations for this pipeline diagram
- Utilizing other available ports in parallel
- Overutilizing ports
- Additional resources
Subscribe to my newsletter, support me on Patreon or by PayPal donation.
I continue writing about performance of the processors and today I want to show some examples of issues that can arise in the CPU backend. In particular today’s topic will be CPU ports contention.
Modern processors have multiple execution units. For example, in SandyBridge family there are 6 execution ports:
- Ports 0,1,5 are for arithmetic and logic operations (ALU).
- Ports 2,3 are for memory reads.
- Port 4 is for memory write.
Today I will try to stress this side of my IvyBridge CPU. I will show when port contention can take place, will present easy to understand pipeline diagramms and even try IACA. It will be very interesting, so keep on reading!
Disclaimer: I don’t want to describe some nuances of IvyBridge achitecture, but rather to show how port contention might look in practice.
Utilizing full capacity of the load instructions
In my IvyBridge CPU I have 2 ports for executing loads, meaning that we can schedule 2 loads at the same time. Let’s look at first example where I will read one cache line (64 B) in portions of 4 bytes. So, we will have 16 reads of 4 bytes. I make reads within one cache-line in order to eliminate cache effects. I will repeat this 1000 times:
max load capacity
; esi contains the beginning of the cache line
; edi contains number of iterations (1000)
.loop:
mov eax, DWORD [esi]
mov eax, DWORD [esi + 4]
mov eax, DWORD [esi + 8]
mov eax, DWORD [esi + 12]
mov eax, DWORD [esi + 16]
mov eax, DWORD [esi + 20]
mov eax, DWORD [esi + 24]
mov eax, DWORD [esi + 28]
mov eax, DWORD [esi + 32]
mov eax, DWORD [esi + 36]
mov eax, DWORD [esi + 40]
mov eax, DWORD [esi + 44]
mov eax, DWORD [esi + 48]
mov eax, DWORD [esi + 52]
mov eax, DWORD [esi + 56]
mov eax, DWORD [esi + 60]
dec edi
jnz .loop
I think there will be no issue with loading values in the same eax register, because CPU will use register renaming for solving this write-after-write dependency.
Performance counters that I use
- UOPS_DISPATCHED_PORT.PORT_X - Cycles when a uop is dispatched on port X.
- UOPS_EXECUTED.STALL_CYCLES - Counts number of cycles no uops were dispatched to be executed on this thread.
- UOPS_EXECUTED.CYCLES_GE_X_UOP_EXEC - Cycles where at least X uops was executed per-thread.
Full list of performance counters for IvyBridge can be found here.
Results
I did my experiments on IvyBridge CPU using uarch-bench tool.
                     Benchmark   Cycles   UOPS.PORT2   UOPS.PORT3   UOPS.PORT5
             max load capacity   8.02     8.00         8.00         1.00
We can see that our 16 loads were scheduled equally between PORT2 and PORT3, each port takes 8 uops. PORT5 takes MacroFused uop appeared from dec and jnz instruction.
The same picture can be observed if use IACA tool (good explanation how to use IACA):
Architecture  - IVB
Throughput Analysis Report
--------------------------
Block Throughput: 8.00 Cycles       Throughput Bottleneck: Backend. PORT2_AGU, Port2_DATA, PORT3_AGU, Port3_DATA

Port Binding In Cycles Per Iteration:
-------------------------------------------------------------------------
|  Port  |  0   -  DV  |  1   |  2   -  D   |  3   -  D   |  4   |  5   |
-------------------------------------------------------------------------
| Cycles | 0.0    0.0  | 0.0  | 8.0    8.0  | 8.0    8.0  | 0.0  | 1.0  |
-------------------------------------------------------------------------

N - port number or number of cycles resource conflict caused delay, DV - Divider pipe (on port 0)
D - Data fetch pipe (on ports 2 and 3), CP - on a critical path
F - Macro Fusion with the previous instruction occurred

| Num Of |              Ports pressure in cycles               |    |
|  Uops  |  0  - DV  |  1  |  2  -  D  |  3  -  D  |  4  |  5  |    |
---------------------------------------------------------------------
|   1    |           |     | 1.0   1.0 |           |     |     | CP | mov eax, dword ptr [rsp]
|   1    |           |     |           | 1.0   1.0 |     |     | CP | mov eax, dword ptr [rsp+0x4]
|   1    |           |     | 1.0   1.0 |           |     |     | CP | mov eax, dword ptr [rsp+0x8]
|   1    |           |     |           | 1.0   1.0 |     |     | CP | mov eax, dword ptr [rsp+0xc]
|   1    |           |     | 1.0   1.0 |           |     |     | CP | mov eax, dword ptr [rsp+0x10]
|   1    |           |     |           | 1.0   1.0 |     |     | CP | mov eax, dword ptr [rsp+0x14]
|   1    |           |     | 1.0   1.0 |           |     |     | CP | mov eax, dword ptr [rsp+0x18]
|   1    |           |     |           | 1.0   1.0 |     |     | CP | mov eax, dword ptr [rsp+0x1c]
|   1    |           |     | 1.0   1.0 |           |     |     | CP | mov eax, dword ptr [rsp+0x20]
|   1    |           |     |           | 1.0   1.0 |     |     | CP | mov eax, dword ptr [rsp+0x24]
|   1    |           |     | 1.0   1.0 |           |     |     | CP | mov eax, dword ptr [rsp+0x28]
|   1    |           |     |           | 1.0   1.0 |     |     | CP | mov eax, dword ptr [rsp+0x2c]
|   1    |           |     | 1.0   1.0 |           |     |     | CP | mov eax, dword ptr [rsp+0x30]
|   1    |           |     |           | 1.0   1.0 |     |     | CP | mov eax, dword ptr [rsp+0x34]
|   1    |           |     | 1.0   1.0 |           |     |     | CP | mov eax, dword ptr [rsp+0x38]
|   1    |           |     |           | 1.0   1.0 |     |     | CP | mov eax, dword ptr [rsp+0x3c]
|   1    |           |     |           |           |     | 1.0 |    | dec rdi
|   0F   |           |     |           |           |     |     |    | jnz 0xffffffffffffffbe
Total Num Of Uops: 17
Why we have 8 cycles per iteration?
On modern x86 processors load instruction takes at least 4 cycles to execute even the data is in the L1-cache. Although according to Agner’s instruction_tables.pdf it has 2 cycles latency. Even if we would have latency of 2 cycles we would have (16 [loads] * 2 [cycles]) / 2 [ports] = 16 cycles. According to this calculations we should receive 16 cycles per iteration. But we are running at 8 cycles per iteration. Why this happens?
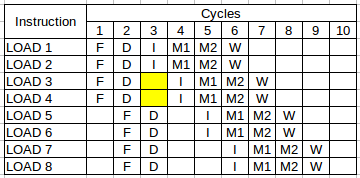
Well, like most of execution units, load units are also pipelined, meaning that we can start second load while first load is in progress on the same port. Let’s draw a simplified pipeline diagram and see what’s going on.

This is simplified MIPS-like pipeline diagram, where we usually have 5 pipeline stages:
- F(fetch)
- D(decode)
- I(issue)
- E(execute) or M(memory operation)
- W(write back)
It is far from real execution diagram of my CPU, however, I preserved some important constraints for IvyBridge architecture (IVB):
- IVB front-end fetches 16B block of instructions in a 16B aligned window in 1 cycle.
- IVB has 4 decoders, each of them can decode instructions that consist at least of a single uop.
- IVB has 2 pipelined units for doing load operations. Just to simplify the diagrams I assume load operation takes 2 cycles. M1 and M2 stage reflect that in the diagram.
It just need to be said that I omitted one important constraint. Instructions always retire in program order, in my later diagrams it’s broken (I simply forgot about it when I was making those diagrams).
Drawing such kind of diagrams usually helps me to understand what is going on inside the processor and finding different sorts of hazards.
Some explanations for this pipeline diagram
- In first cycle we fetch 4 loads. We can’t fetch LOAD5, because it doesn’t fit in the same 16B aligned window as first 4 loads.
- In second cycle we were able to decode all 4 fetched instructions, because they all are single-uop instructions.
- In third cycle we were able to issue only first 2 loads. One of such load goes to PORT2, the second goes to PORT3. Notice, that LOAD3 and LOAD4 are stalled (typically waiting in Reservation Station).
- Only in cycle #4 we were able to issue LOAD3 and LOAD4, because we know M1 stages will be free to use in next cycle.
Continuing this diagram further we could see that in each cycle we are able to retire 2 loads. We have 16 loads, so that explains why it takes only 8 cycles per iteration.
I made additional experiment to prove this theory. I collected some more performance counters:
                     Benchmark   Cycles   CYCLES_GE_3_UOP_EXEC   CYCLES_GE_2_UOP_EXEC   CYCLES_GE_1_UOP_EXEC
             max load capacity   8.02     1.00                   8.00                   8.00
Results above show that in each of 8 cycles (that it took to execute one iteration) at least 2 uops were issued (two loads issued per cycle). And in one cycle we were able to issue 3 uops (last 2 loads + dec-jnz pair). Conditional branches are executed on PORT5, so nothing prevents us from scheduling it in parrallel with 2 loads.
What is even more interesting is that if we do simulation with assumption that load instruction takes 4 cycles latency, all the conclusions in this example will be still valid, because the throughput is what matters (as Travis mentioned in his comment). There will be still 2 retired load instructions each cycle. And that would mean that our 16 loads (inside each iteration) will retire in 8 cycles.
Utilizing other available ports in parallel
In the example that I presented, I’m only utilizing PORT2 and PORT3. And partailly PORT 5. What does that mean? Well, it means that we can schedule instructions on another ports in parrallel with loads just for free. Let’s try to write such an example.
I added after each pair of loads one bswap instruction. This instruction reverses the byte order of a register. It is very helpful for doing big-endian to little-endian conversion and vice-versa. There is nothing special about this instruction, I just chose it because it suites best to my experiments.
According to Agner’s instruction_tables.pdf bswap instruction on a 32-bit register is executed on PORT1 and has 1 cycle latency.
max load capacity + 1 bswap
; esi contains the beginning of the cache line
; edi contains number of iterations (1000)
.loop:
mov eax, DWORD [esi]
mov eax, DWORD [esi + 4]
bswap ebx
mov eax, DWORD [esi + 8]
mov eax, DWORD [esi + 12]
bswap ebx
mov eax, DWORD [esi + 16]
mov eax, DWORD [esi + 20]
bswap ebx
mov eax, DWORD [esi + 24]
mov eax, DWORD [esi + 28]
bswap ebx
mov eax, DWORD [esi + 32]
mov eax, DWORD [esi + 36]
bswap ebx
mov eax, DWORD [esi + 40]
mov eax, DWORD [esi + 44]
bswap ebx
mov eax, DWORD [esi + 48]
mov eax, DWORD [esi + 52]
bswap ebx
mov eax, DWORD [esi + 56]
mov eax, DWORD [esi + 60]
bswap ebx
dec edi
jnz .loop
Here are the results for such experiment:
                     Benchmark   Cycles   UOPS.PORT1   UOPS.PORT2   UOPS.PORT3   UOPS_PORT5
   max load capacity + 1 bswap   8.03     8.00         8.01         8.01         1.00
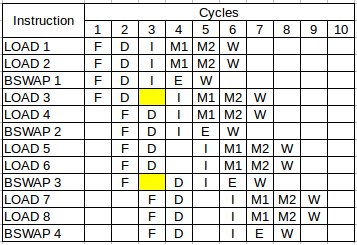
First observation is that we get 8 more bswap instructions just for free (we are running still at 8 cycles per iteration), because they do not contend with load instructions. Let’s look at the pipeline diagram for this case:

We can see that all bswap instructions nicely fit into the pipeline causing no hazards.
Overutilizing ports
Modern compilers will try to schedule instructions for particular target architecture to fully utilize all execution ports. But what happens when we try to schedule too much instruction for some execution port? Let’s see.
I added one more bswap instruction after each pair of loads:
port 1 throughput bottleneck
; esi contains the beginning of the cache line
; edi contains number of iterations (1000)
.loop:
mov eax, DWORD [esi]
mov eax, DWORD [esi + 4]
bswap ebx
bswap ecx
mov eax, DWORD [esi + 8]
mov eax, DWORD [esi + 12]
bswap ebx
bswap ecx
mov eax, DWORD [esi + 16]
mov eax, DWORD [esi + 20]
bswap ebx
bswap ecx
mov eax, DWORD [esi + 24]
mov eax, DWORD [esi + 28]
bswap ebx
bswap ecx
mov eax, DWORD [esi + 32]
mov eax, DWORD [esi + 36]
bswap ebx
bswap ecx
mov eax, DWORD [esi + 40]
mov eax, DWORD [esi + 44]
bswap ebx
bswap ecx
mov eax, DWORD [esi + 48]
mov eax, DWORD [esi + 52]
bswap ebx
bswap ecx
mov eax, DWORD [esi + 56]
mov eax, DWORD [esi + 60]
bswap ebx
bswap ecx
dec edi
jnz .loop
When I measured result using uarch-bench tool here is what I received:
                     Benchmark   Cycles   UOPS.PORT1   UOPS.PORT2   UOPS.PORT3   UOPS_PORT5
  port 1 throughput bottleneck   16.00    16.00        8.01         8.01         1.00
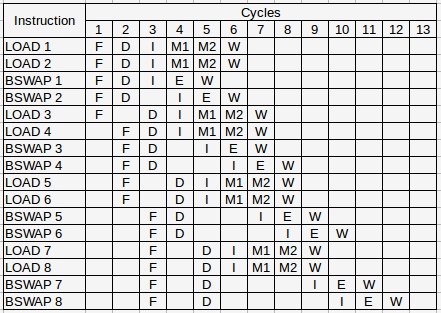
To understand why we now run at 16 cycles per iteration, it’s best to look at the pipeline diagram again:

Now it’s clear to see that we have 16 bswap instructions and only one port that can handle this kind of instructions. So, we can’t go faster than 16 cycles in this case, because IVB processor executes them sequentially. Different architectures might have more ports to handle bswap instructions which may allow them to run faster.
By now I hope you understand what port contention is and how to reason about such issues. Know limitations of your hardware!
Additional resources
More detailed information about execution ports of your processor can be found in Agner’s microarchitecture.pdf and for Intel processors in Intel’s optimization manual.
All the assembly examples that I showed in this article are available on my github.
UPD 23.03.2018
Several people mentioned that load instructions can’t have 2 cycles latency on modern Intel Architectures. Agner’s tables seems to be not accurate there.
I will not redo the diagrams as it will be difficult to understand them, and they will shift the focus from the actual thing I wanted to explain. Again, I didn’t want to reconstruct how the pipeline diagram will look in reality, but rather to explain the notion of port contention. However, I totally accept the comment and it should mentioned.
But also if we assume that load instruction takes 4 cycles latency in those examples, all the conclusions in the post are still valid, because the throughput is what matters (as Travis mentioned in his comment). There will be still 2 retired load instructions per cycle.
Another important thing to mention is that hyperthreading helps utilize execution “slots”. See more details in HackerNews comments.
All content on Easyperf blog is licensed under a Creative Commons Attribution 4.0 International License